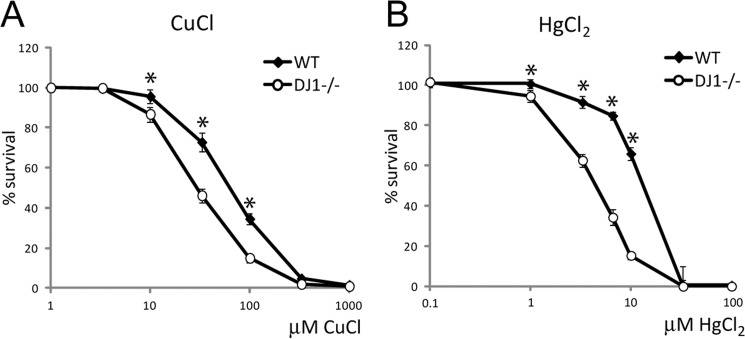
FIGURE 2.
Metal exposure and analysis of cell survival. Cell survival data compared WT and DJ-1−/− MEF cells exposed to increasing concentrations of metals for 24 h. All values were compared with nontreated control set to 100% survival and plotted against the logarithmic scale for the used metal concentrations. A, CuCl, WT LC50 = 70 μm, DJ-1−/− LC50 = 30 μm. B, HgCl2, WT LC50 = 15 μm, DJ-1−/− LC50 = 4 μm. Statistically significant change in cell survival compared with DJ-1−/− cells is indicated with *, p < 0.05.

