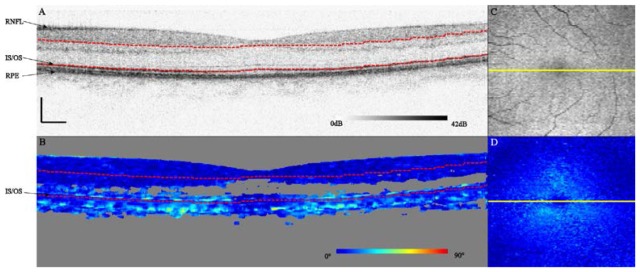
Fig. 1.

Logarithmic intensity (A) and DPPR (B) B-scans centered on the fovea of the right eye of a 55-year old subject. Scale bars represent a length of 250 μm. Pixels with an effective standard deviation in the orientation of the polarization state larger than 4° were colored gray. On the right, an en face intensity C-scan obtained at the IS/OS (C) and DPPR C-scan (D) are shown. The location of the B-scan is marked by a yellow line. Red dashed lines in the B-scans indicate the reference and measurement locations for the DPPR calculation. While the DPPR data were averaged to reduce the influence of noise, the intensity data (A,C) were not. This link shows a movie of all 100 B-scans (Media 1 (9MB, AVI) ).
