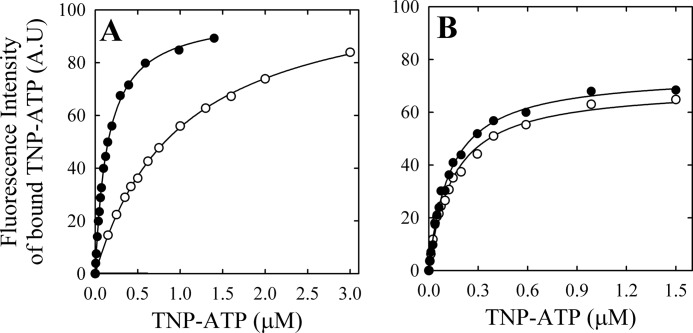
FIGURE 8.
Binding of TNP-ATP to PMCA. Fluorescence intensity of bound TNP-ATP to PMCA as a function of the concentration of TNP-ATP was determined as described under “Experimental Procedures” in the presence of 100 μm free Ca2+ (closed circles) or 2 mm EGTA (open circles) (A) and in the presence of 50 μm (VO4)3− and either 100 μm free Ca2+ (closed triangles) or 2 mm EGTA (open triangles) (B). The continuous line is the graph of Equation 4 using the best fitting parameters shown in Table 3.

