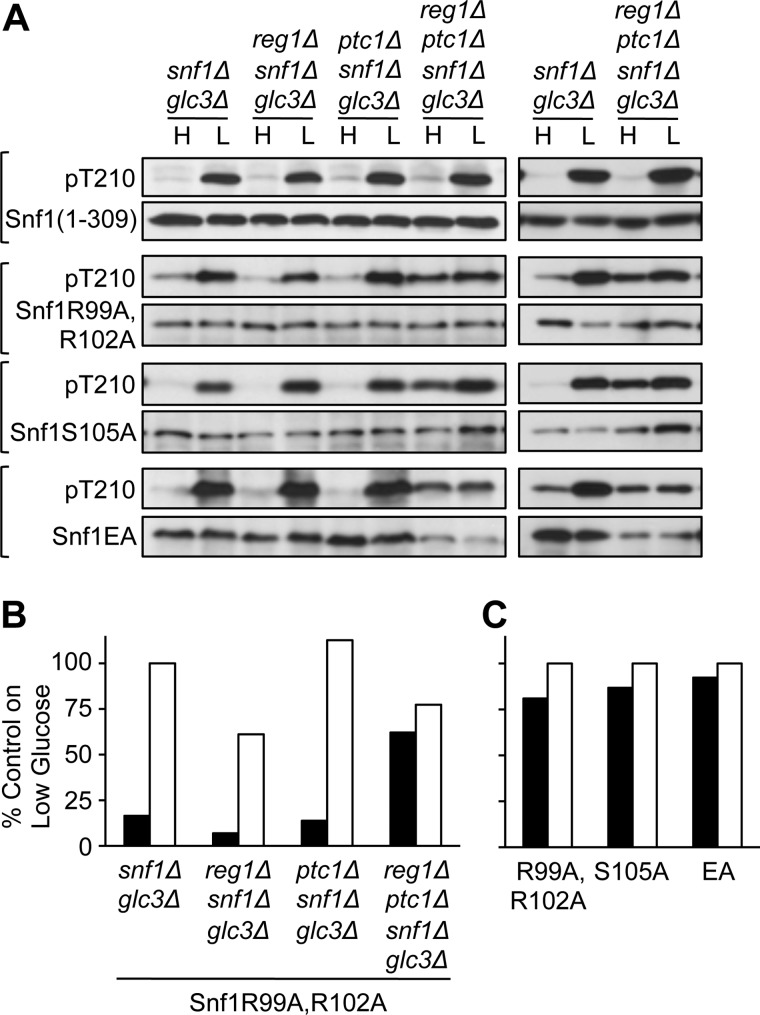
FIGURE 3.
Thr-210 phosphorylation in reg1Δ ptc1Δ cells expressing mutant Snf1 proteins. A, cells of the indicated genotype expressed each mutant Snf1 protein from the SNF1 promoter on a centromeric plasmid. Snf1(1–309)-myc was expressed from pXX7. Other mutant Snf1 proteins carried the indicated Ala substitutions. The left and right blots show independent transformants. Immunoblot analysis of Snf1 Thr-210 phosphorylation was as described in Fig. 1. B, quantification of phosphorylated Thr-210, normalized to Snf1 protein, as in Fig. 2C, for the transformants expressing Snf1 R99A,R102A shown on the left blot of A. Values for high (H) glucose (dark bars) and low (L) glucose (open bars) are shown as percentage of the value obtained for the snf1Δ glc3Δ sample on low glucose. C, quantification of phosphorylated Thr-210, normalized to Snf1 protein, for reg1Δ ptc1Δ snf1Δ glc3Δ transformants expressing each mutant Snf1 protein. Values are shown as percentage of the value obtained for the same transformant on low glucose and are averages for the two transformants shown.

