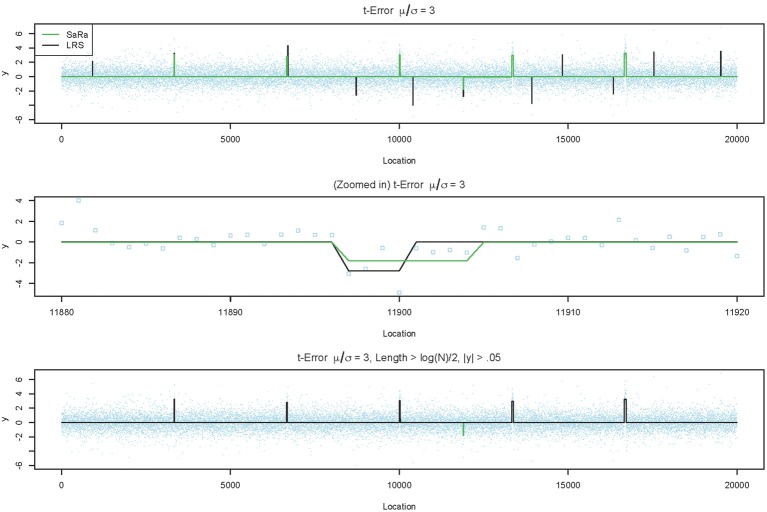
Figure 3.
LRS and SaRa results on simulation before and after pruning. The top figure runs the standard LRS and SaRa procedure and results in a few false positives. The middle figure shows the difference width and magnitude between two algorithms for one false positive. The bottom figure is the result of removing small width aberrations. This now matches the true simulated profile for LRS but the false positive for SaRa remains.

