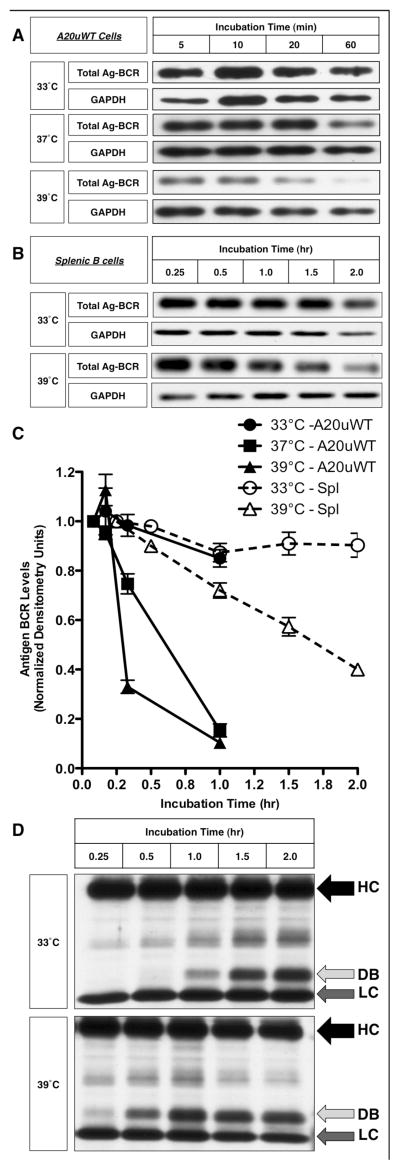
Figure 5. Fever Range Temperature Accelerates the Kinetics of BCR-mediated Antigen Processing.
Panel A – A20μWT B cells were pre-incubated at the indicated temperature for 2 hours, pulsed with anti-BCR-btn at the same temperature, whole cell lysates prepared and the kinetics of anti-BCR-btn degradation determined by SDS-PAGE and blotting with SA-HRP. GAPDH was used as a loading control. Shown are representative results from 1 of 3 independent experiments. Panel B – B.10.Br splenic B cells were pre-incubated at the indicated temperature for 2 hours, and the kinetics of BCR-mediated antigen processing of anti-BCR-btn was determined by staining with SA-HRP and reducing SDS PAGE western blot. Shown are representative results from 1 of 3 independent experiments. Panel C – Densitometric analysis of the average degradation (over 3 independent experiments) of “Total Ag-BCR” by A20μWT cells and splenic B cells (spl). Bars = +/− 1 S.D. Statistical analysis: A20μWT, 33 vs. 39°C at 60 minutes, p = 0.005, splenocytes, 33 vs. 39°C at 2 hours, p = 0.006. Panel D – Longer exposure of a blot from an experiment similar to that shown in Panel B. The arrows labeled “HC” and “LC” indicate the intact heavy and light chains of the bound anti-BCR-btn antibody. The arrow labeled “DB” indicates a “degradation band” (derived from the proteolytic degradation of the intact anti-BCR-btn heavy chain, HC) that is generated more rapidly at 39°C. Shown are representative results from 1 of 3 independent experiments.

