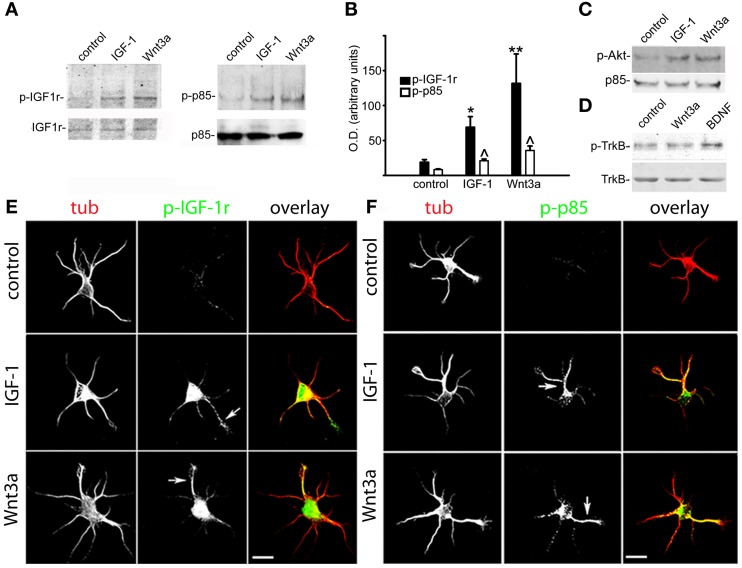
Figure 2.
Wnt3a elicited the polarized activation of IGF-1r and PI3k in hippocampal neurons. (A) Western blots of active (phosphorylated) IGF-1r (left) and phosphorylated p85 (right) in control GCPs and GCPs stimulated with either 20 nM IGF-1 or 1.35 nM Wnt3a. Growth cone particles were incubated for 30 min on ice with growth factors and incubated at 37°C for 5 min in the presence of 1 mM ATP. Note the noticeable increment in both the active form of IGF-1r (left) and phosphorylated p85 (right). IGF-1r (left) or total p85 (right) were included as loading controls. (B) Relative optical densities of active IGF-1r and phosphorylated p85 in the western blots [similar to those shown in panel (A)]. Note the significant increment of both active IGF-1r and phosphorylated p85 in the GCPs stimulated with IGF-1 (*p < 0.01; ∧p < 0.05) or Wnt3a (**p < 0.001; ∧p < 0.05) compared with control. Values are the average + sem of three independent experiments. (C) Western blots of active (phosphorylated) Akt in control GCPs or GCPs stimulated with either 20 nM IGF-1 or 1.35 nM Wnt3a. Growth cone particles were kept on ice for 30 min with the growth factors and incubated at 37°C for 5 min in the presence of 1 mM ATP, p85 was included as a loading control. (D) Western blots of active (phosphorylated) TrkB receptors in control GCPs or GCPs stimulated with 20 nM IGF-1, 1.35 nM Wnt3a, or 50 ng/ml BDNF. Growth cone particles were kept on ice for 30 min with the growth factors and incubated at 37°C for 5 min in the presence of 1 mM ATP. Total TrkB was included for comparison. (E) Double immunofluorescence micrographs of hippocampal neurons after 12 h in culture showing the distribution of the neuronal marker β-III tubulin (tub) and active IGF-1r (p-IGF-1r). Cells were cultured in control medium (control) and challenged for 5 min with either 20 nM IGF-1 (middle) or 1.35 nM Wnt3a (bottom). Note that active IGF-1r was polarized to one neurite in the cells challenged with either IGF-1 (middle arrowhead) or Wnt3a (bottom arrowhead) in stage 2 neurons that had not exhibited a discernible axon. (F) Double immunofluorescence micrographs of hippocampal neurons after 12 h in culture showing the distribution of the neuronal marker β-III tubulin (tub) and phosphorylated p85 (p-p85). Cells were cultured in control medium (control) and challenged for 5 min with 20 nM IGF-1 (middle) or 1.35 nM Wnt3a (bottom). Note that phosphorylated p85 was polarized to one neurite in the cells challenged with either IGF-1 (middle arrowhead) or Wnt3a (bottom arrowhead) in stage 2 neurons that had not exhibited a discernible axon. Scale bars: 20 μm.

