
Fig. 2.
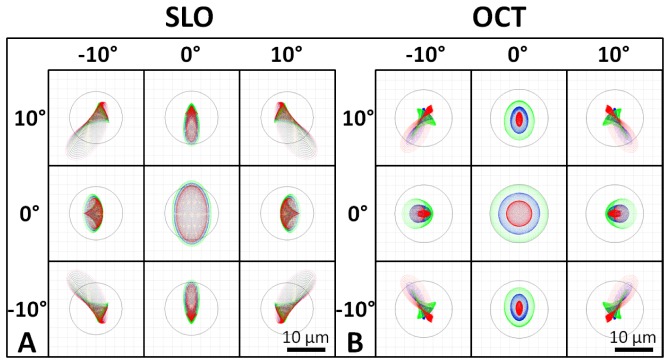
Spot diagrams for the SLO (A) and the OCT (B) illumination on the retina spanning a 20° FOV. SLO and OCT are nearly diffraction limited at 7 and 7.5 µm (the Airy disk radii), respectively (Airy disk is shown by black circle on spot diagrams). Spot diagrams are color coded for 3 wavelengths spanning the bandwidth of the respective sources. SLO spot diagrams have increased astigmatism compared to OCT spot diagrams due to the transmission through the tilted dichroic mirror.