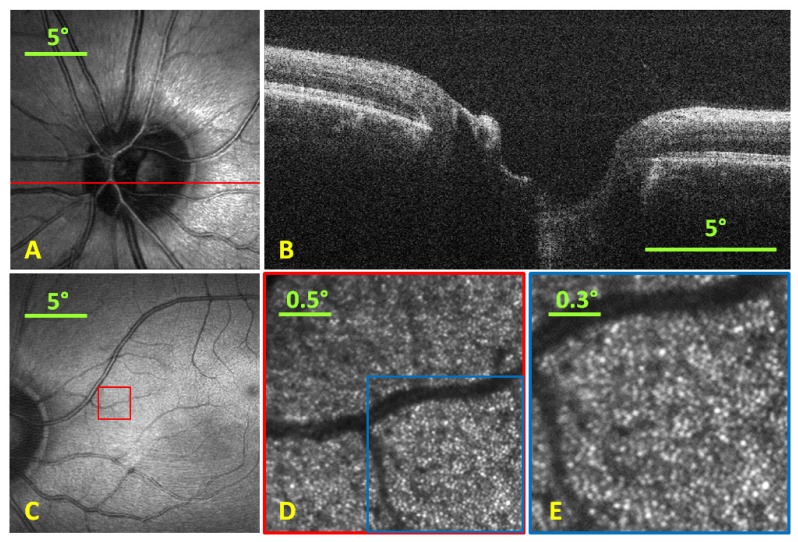
Fig. 5.
A) SLO image (single frame) with red line representing location of B-scan. B) Single B-scan taken simultaneously with the SLO at 40 fps. C) Foveal SLO image (single frame) indicating the position where the SLO was optically zoomed to visualize parafoveal cones. D) Optically zoomed retinal image (5 frame average) via reduction of scan range to a 2.5° FOV at location shown by red box in C) at an 11° eccentricity. E) Digitally zoomed image at location shown by blue box in D) with a 1.5° FOV showing the cone photoreceptor mosaic.

