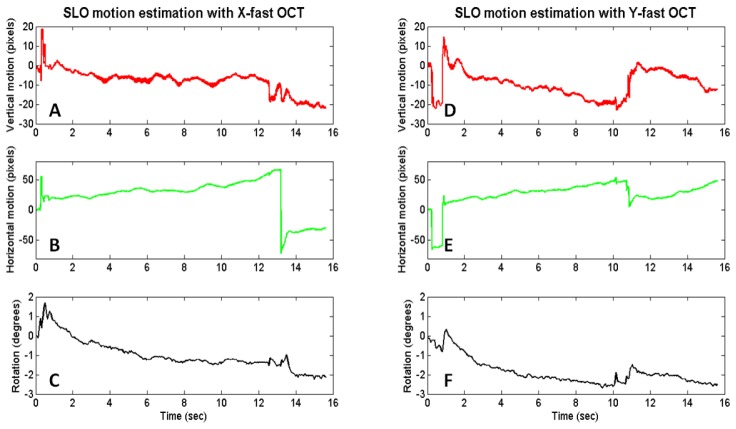
Fig. 8.
SLO motion estimation with X-fast (A-C) and Y-fast (D-F) OCT. A slow horizontal drift is visualized in the X-fast motion estimation with a large saccade captured at around the 13 second point. Both vertical and horizontal drifts are apparent in the Y-fast motion estimation with two microsaccades captured at around the 0.5 and 11 second points.

