
Fig. 3.
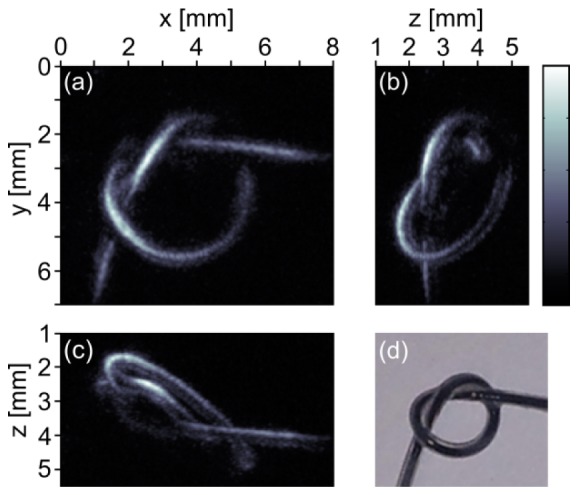
(a)-(c) Maximum intensity projections of a silicone loop filled with ink along the z-, x-, and y-direction, respectively. Data were acquired by single-shot measurements, i.e. without averaging. (d) Photograph of the ink-filled tube taken after the measurement.