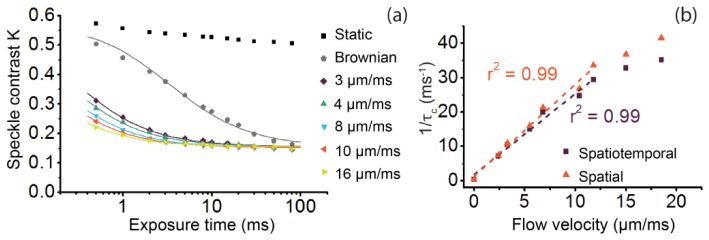
Fig. 5.

Flow phantom speckle decorrelation results. (a) Multi exposure speckle contrast values (data points) and corresponding fit (lines) for several different flow velocities. The K values (Ns = 7, Nt = 20) are fitted to Eq. (7) for the flow data, while Eq. (6) is fitted to the Brownian motion data.(b) Fit parameter τc (plotted as 1/τc) from multi exposure speckle contrast fits for several flow velocities between 0 - 20 µm/ms (mm/s), applying a spatiotemporal (purple squares) and a spatial (orange triangles) local region, consisting of 7 × 7 × 20 and 31 × 31 pixels respectively, and its linear fit (dashed line).
