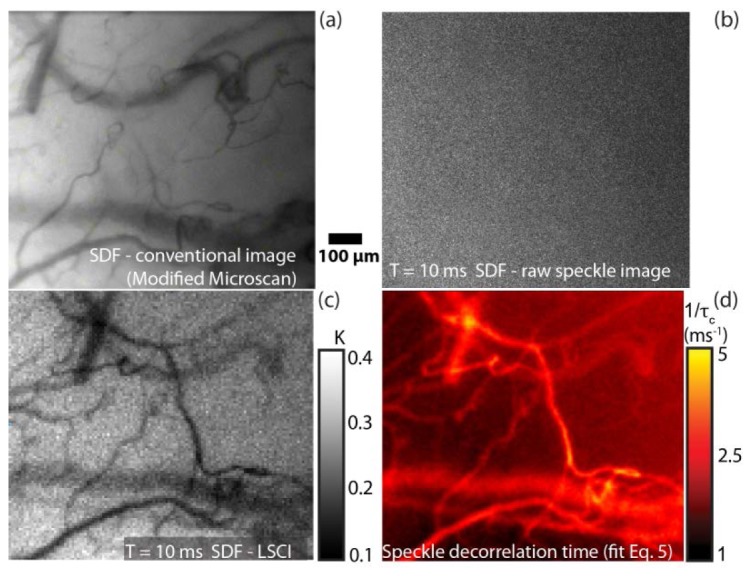
Fig. 6.

In vivo SDF-LSCI recording and analysis procedure. (a) Typical SDF image of sublingual microcirculation. (b) Raw speckle image and (c) processed K-image (Ns = 7, Nt = 20) of same region as in (a), recorded at T = 10 ms. For each pixel and exposure time, K was estimated to enable a pixel wise multi exposure curve fit (Eq. (7)), resulting in a 1/τc map of the same region as in (a), shown in (d). In Media 2 (1.6MB, MPG) and Media 3 (7.7MB, MPG) the four panels are presented as a video, showing flowing RBC's (top left), raw speckle (top right) and speckle contrast (bottom left) images, and a still frame (bottom right) of the corresponding 1/τ c map. Media 2 (1.6MB, MPG) (1.6 Mb) represents SDF-LSCI at T = 10 ms, while Media 3 (7.7MB, MPG) (7.9 Mb represents SDF-LSCI at T = 1, 2, 10, 20 and 50 ms consecutively.
