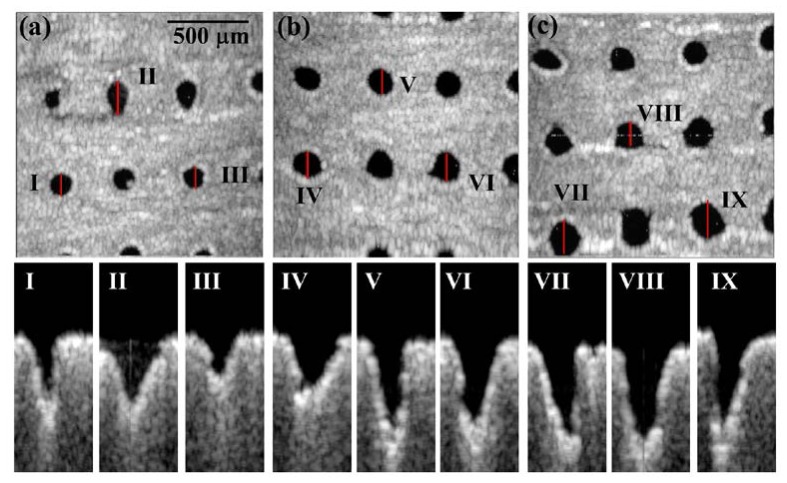
Fig. 2.
OCT images of the phantom exposed to various AFL exposure energies. (a), (b), and (c) represent en-face images at the depth of 250 μm beneath the phantom surface for exposure energies of 15, 20 and 25 mJ, respectively. (I)-(IX): B-mode results of locations I-XI indicated by the red lines in (a), (b), and (c).

