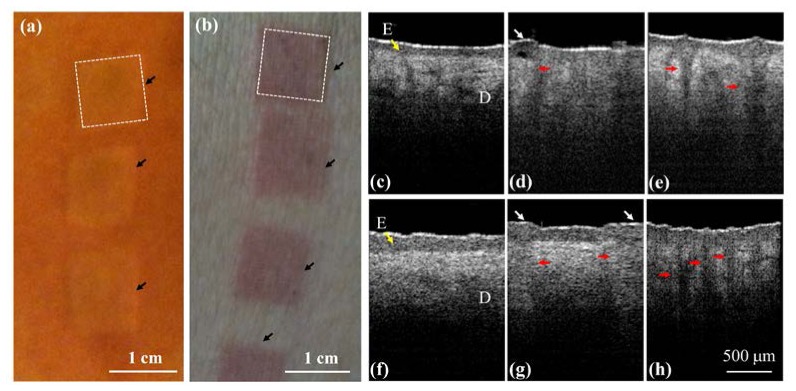
Fig. 3.

In vivo results of skin before and after NAFL and AFL exposures. (a), (b) pictures of belly skin taken after NAFL and AFL exposures, respectively. The black arrows indicate the exposed areas, and each area equals approximately 1 × 1 cm2. (c), (f) the OCT results of facial and belly skin before laser exposures, respectively. (d), (g) the OCT results of facial and belly skin after NAFL exposures at 25 mJ. (e), (h) the OCT results of facial and belly skin after AFL exposures at 25 mJ. The epidermal layer is indicated by the yellow arrow. The red arrows indicate the structures of the induced MTZs, and the white arrows represent micro-epidermal necrotic debris (MEND). E: epidermis.
