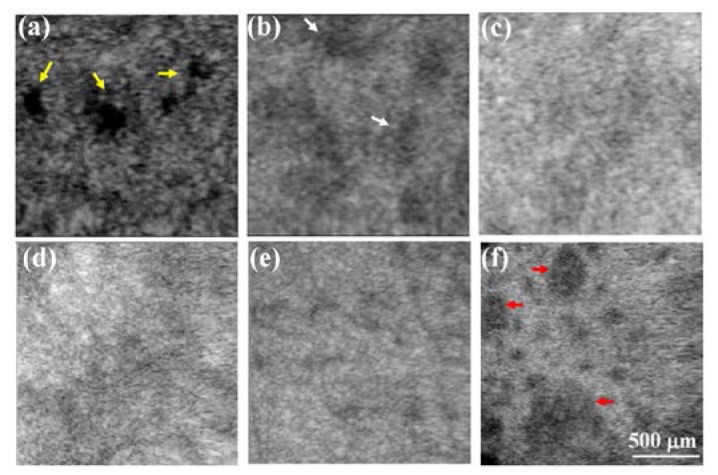
Fig. 5.

(a)-(d) En-face images of the basement membrane obtained on day 0, day 2, day 4, and day 6. The yellow arrows indicate the cleft basement membrane caused by the exposure to a higher energy of 25 mJ, and the white arrows represent the damaged spots on the basement membrane induced by the NAFL exposure. (e), (f) En-face images at a deeper depth of 500 μm below the skin surface, obtained before and 1 month after the NAFL treatment. The spots indicated by the red arrows show the appearance of tissue scaring even though the tissue had completely healed, providing evidence of collagen regeneration.
