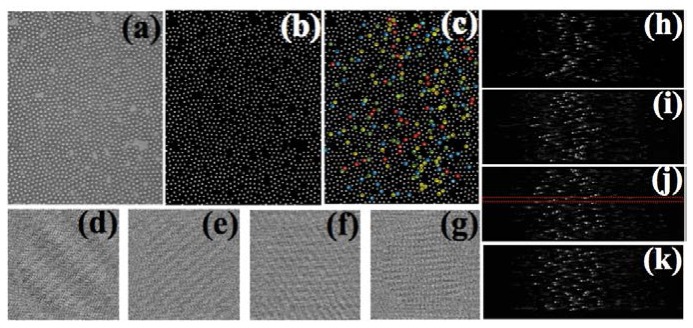
Fig. 3.

(a) Bright-field image of a mixed sample of 2 μm PS and MR microspheres; (b) binarized centroid image after image processing; (c) random selection of 15% of microspheres and splitting into four color-coded groups (patterns); (d-g) holograms corresponding to the four groups (patterns) selected in (c); (h-k) raw Raman images corresponding to the illumination patterns according to the holograms in (d-g).
