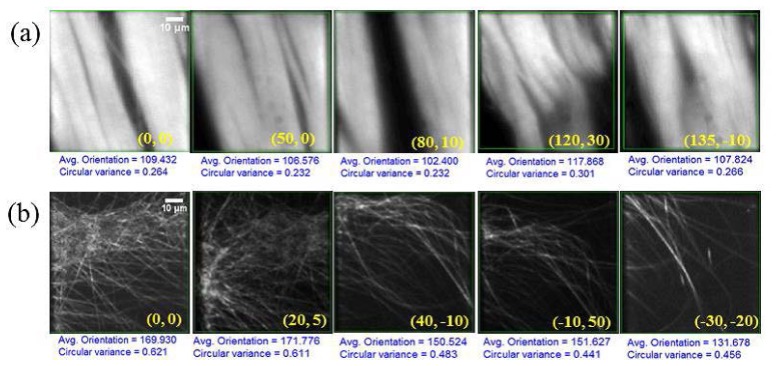
Fig. 3.

SHG images of stage-scanned (a) tendon (Media 1 (2.1MB, MP4) ) and (b) collagen scaffold fibers (Media 2 (1.7MB, MP4) ) at different locations shown in top left corner. The lateral coordinates for each image, relative to the initial (0, 0), are provided in the bottom right hand corner for each frame. The same scale applies to all images. See text for additional details.
