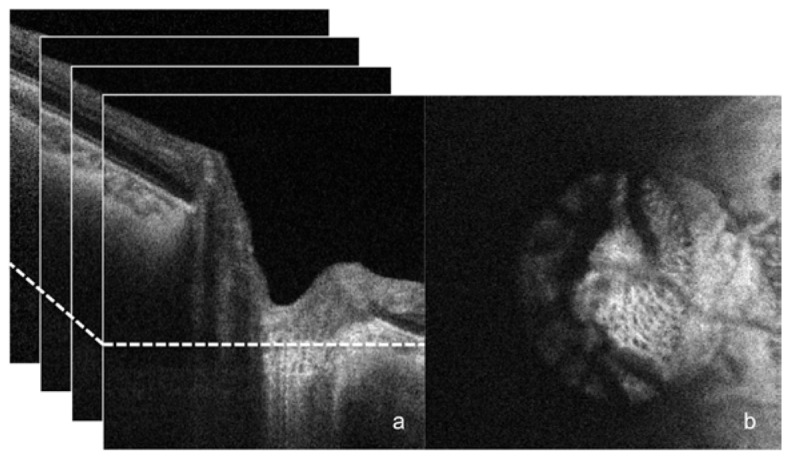
Fig. 1.

SS-OCT scan of healthy eye. B-scan frames are stacked (a) into a 3D data cube from which an individual C-mode slice is selected at random (at the location of the dotted line on the left) to undergo manual and automated segmentation analysis (b).
