
Fig. 1.
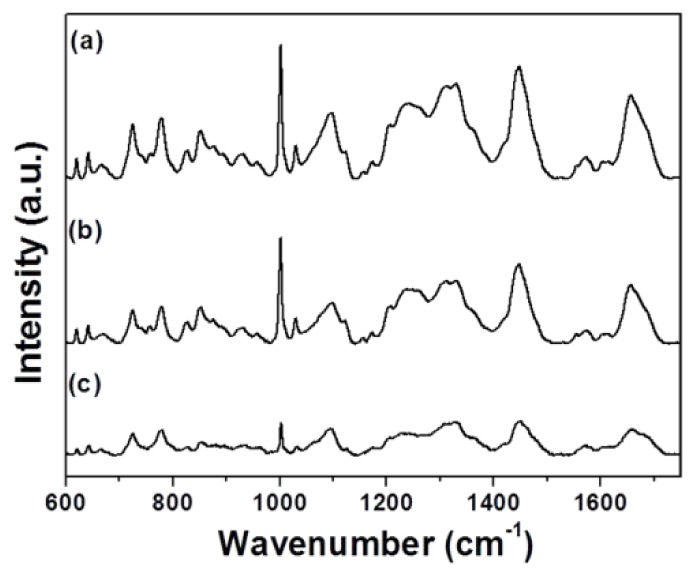
Averaged Raman spectra of L929 cells: (a) Control and (b) Dermabond-treated. The spectrum (c) shows the spectral differences of control cells and cells treated with Dermabond tissue adhesive.
Official websites use .gov
A
.gov website belongs to an official
government organization in the United States.
Secure .gov websites use HTTPS
A lock (
) or https:// means you've safely
connected to the .gov website. Share sensitive
information only on official, secure websites.
Averaged Raman spectra of L929 cells: (a) Control and (b) Dermabond-treated. The spectrum (c) shows the spectral differences of control cells and cells treated with Dermabond tissue adhesive.