Fig. 1.
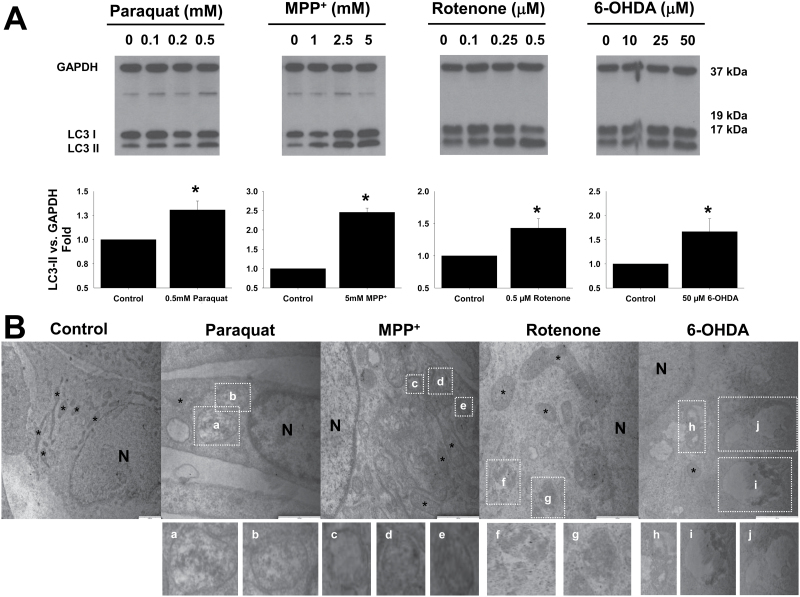
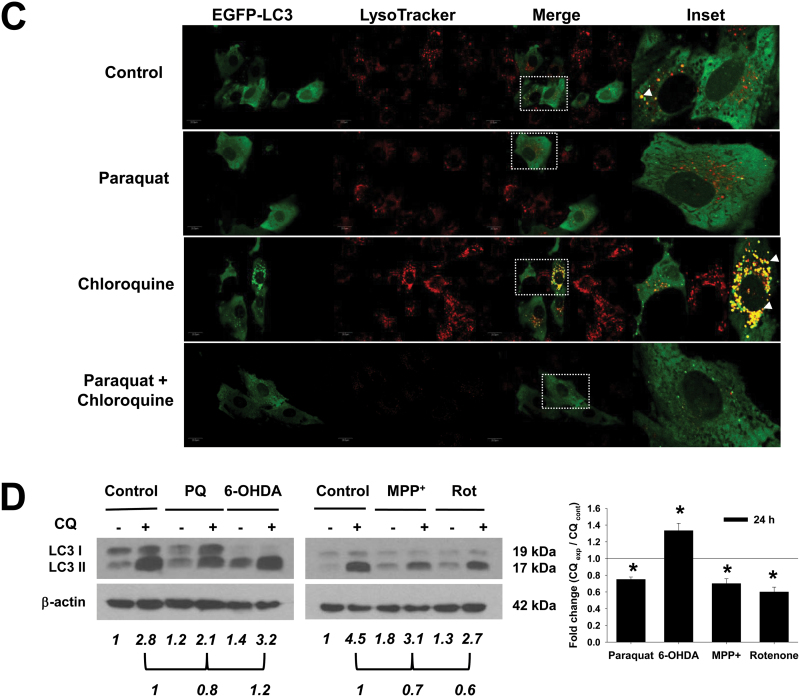
Alterations in autophagic flux induced by PD toxins. A, Human dopaminergic SK-N-SH cells were treated with PD neurotoxins at the indicated concentrations for 24h. Accumulation of LC3-II was analyzed by WB in whole-cell lysates. B, Autophagy morphology was evaluated by TEM. Representative electron micrographs show typical features of double-membraned vesicles (autophagosomes [c–g]) and autolysosomes (a, b, h–j), which exhibited late autophagic compartment containing partially degraded, electron-dense materials, as evidenced in the magnified images of boxed areas. N, nucleus; *, mitochondria. Bars indicate 1-μm scale. Normal SK-N-SH (D) or cells transduced with 2.5 MOI Ad-EGFP-LC3 (C) were treated with PQ (0.5mM), MPP+ (2.5mM), rotenone (Rot, 4μM), or 6-OHDA (50μM) for 24h and 40μM CQ was added 2h before analysis. In (C), cells were stained with LysoTracker Red (500nM) for 15min prior to confocal microscopy imaging. Boxed areas (B and C) in the merged panels are enlarged and represented in the insets. Autophagolysosome formation is indicated by white arrowheads highlighting EGFP-LC3 and LysoTracker colocalization. D, WB is representative of 3 independent experiments. Data in bar graphs represent the ratio of LC3-II/GAPDH or /β-actin normalized against control (untreated) samples (A) or CQ-treated cells (D) and are means ± SEM of 3 independent experiments. *p < .05, significant difference between values of the corresponding drug-treated and untreated cells in the absence (A) or presence of CQ (D). Abbreviations: 6-OHDA, 6-hydroxydopamine; CQ, chloroquine; MOI, multiplicity of infection; MPP+ , 1-methyl-4-phenylpyridinium; PQ, paraquat; PD, Parkinson’s disease; TEM, transmission electron microscopy; WB, Western immunoblotting.


