Fig. 2.
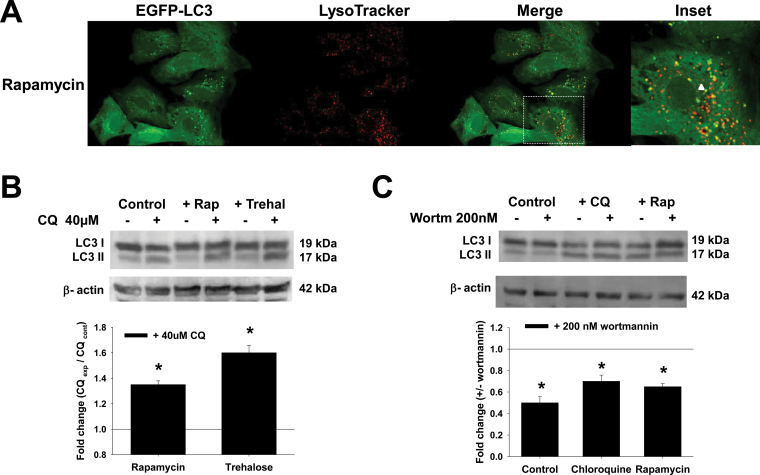
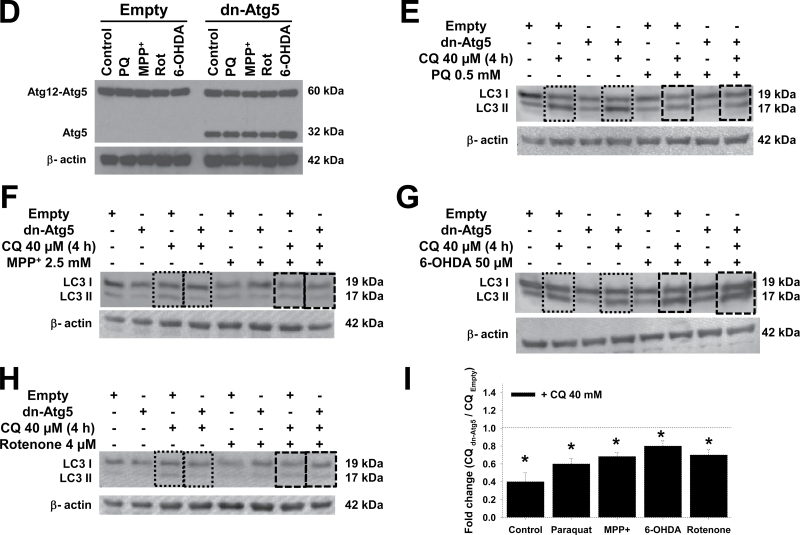
Pharmacological and genetic approaches used to modulate autophagy flux and Atg5-dependent autophagy. A, Cells were transduced with Ad-EGFP-LC3 (2.5 MOI) for 24h and then treated with 5μM rapamycin for 24h. Cells were stained with LysoTracker and analyzed by confocal microscopy. The boxed area in the merged panel is enlarged and represented in the inset. Autophagolysosome formation is indicated by white arrowheads highlighting EGFP-LC3 and LysoTracker colocalization. B and C, Cells were treated with rapamycin (5μM) and trehalose (100mM) for 24h in the presence or absence of CQ (40μM for 4h before analysis) or wortmannin (200nM, 24h). D–H, Cells were infected for 24h with Ad-Empty or Ad-dnAtg5 at 1.5 MOI followed by treatment with PQ (0.5mM), MPP+ (2.5mM), rotenone (Rot, 4μM), or 6-OHDA (50μM) for 24h. LC3-II accumulation and Atg12-Atg5 complex were evaluated by WB. Blots are representative experiments. I, Autophagic flux was evaluated in cells treated with CQ (40μM) 4h prior to collection. Changes in LC3-II/β-actin signal induced by dnAtg5 with respect to cells infected with Empty virus in the presence of CQ, was evaluated in controls (dotted lines) or cells treated with parkinsonian mimetics (broken lines). *p < .05, significant difference between cells infected with dnAtg5 and Empty viruses. Abbreviations: 6-OHDA, 6-hydroxydopamine; CQ, chloroquine; dnAtg5, dominant negative form of Atg5; MOI, multiplicity of infection; MPP+ , 1-methyl-4-phenylpyridinium; PQ, paraquat; WB, Western immunoblotting.


