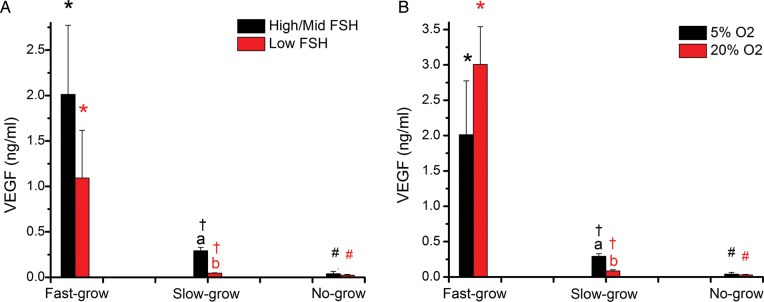
Figure 2.

VEGF-A concentrations in media from no-grow (NG), slow-grow (SG) and fast-grow (FG) follicles following 5 weeks of culture in (A) low or high/mid FSH (NG, n = 11 and 27; SG, n = 13 and 49; FG, n = 6 and 15 from 9 monkeys) at 5% O2 and (B) 5 or 20% O2 (NG, n = 27 and 20; SG, n = 49 and 8; FG, n = 15 and 2 from 6 monkeys) in the presence of high/mid FSH. Data are presented as mean ± SEM. Panel A: “a”s on FG data points mean VEGF concentrations in high/mid FSH culture is not different from low FSH culture for fast-grow follicles; a and b on SG data points mean VEGF concentrations in high/mid FSH culture is different from low FSH culture for slow-grow follicles; “a”s on NG data points mean VEGF concentrations in high/mid FSH culture is not different from low FSH culture for no-grow follicles. *,† and # on high/mid FSH data points mean VEGF concentrations in FG is different from SG and NG, and SG is different from NG at high/mid dose of FSH; *,† and # on low FSH data points mean VEGF concentrations in FG is different from SG and NG, and SG is different from NG at low dose of FSH. a,bSignificant differences between low (red) and high/mid (black) FSH doses for SG follicles (P < 0.05). *,†,#Significant differences between NG, SG and FG follicles in the presence of low and high/mid FSH (P < 0.05). Panel B: “a”s on FG data points mean VEGF concentrations in 5% O2 culture is not different from 20% O2 culture for fast-grow follicles; a and b on SG data points mean VEGF concentrations in 5% O2 culture is different from 20% O2 culture for slow-grow follicles; “a”s on NG data points mean VEGF concentrations in 5% O2 culture is not different from 20% O2 culture for no-grow follicles. a,bSignificant differences between 20% (red) and 5% (black) O2 concentrations for SG follicles (P<0.05). *,†,#Significant differences between NG, SG and FG follicles in the presence of 20% and 5% O2 (P<0.05). *,† and # on 5% O2 data points mean VEGF concentrations in FG is different from SG and NG, and SG is different from NG at 5% O2; *,† and # on 20% O2 data points mean VEGF concentrations in FG is different from SG and NG, and SG is different from NG at 20% O2.
