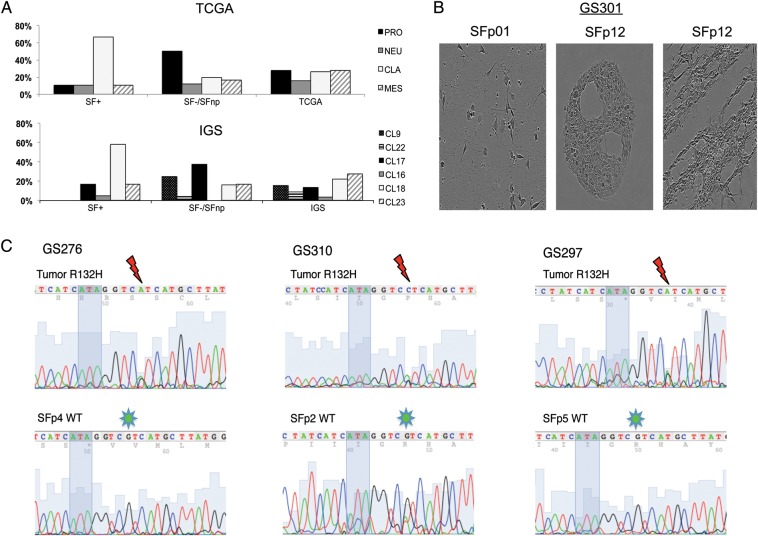
Fig. 4.
Gene expression profiling and IDH1 sequencing data demonstrates SF culture selects for TCGA CLA/IGS-18 and IDH1 wild-type tumors. (A) Distribution of SF+ and SF− samples across the previously published TCGA and IGS classifiers. Samples were assigned according to the centroids as published in the original reports, on the right. Proneural samples are spread between IGS-9, -17, and -22. Noteworthy is the lack of IGS-9 and -22 in the SF+ group, as well as the overrepresentation of IGS-18/CLA samples in the SF+ population compared with the incidences reported in the original publications. (B) Sequencing illustrations of IDH1 codons 130 (ATA in shadow) through 134. Thundermarks indicate G to A or C mutation in codon R132, indicative of R132H. Note the loss of this mutation in GS276 and GS297 SF passages. In GS310 SFp2 the sequence reveals a minor A peak, demonstrating an ambiguous mutation pattern, indicative of mixed populations of mutated tumor cells and (nonneoplastic) IDH-WT cells. (C) Microscopic images of GS301 SS/SF cultures demonstrate loss of neoplastic cells. SF culture retains original morphology as found in p0 for a longer duration than SS; however, eventually (p12) proliferation of nonneoplastic stromal cells is abundant with typical accumulation of bands and halos suggestive for fibroblasts.

