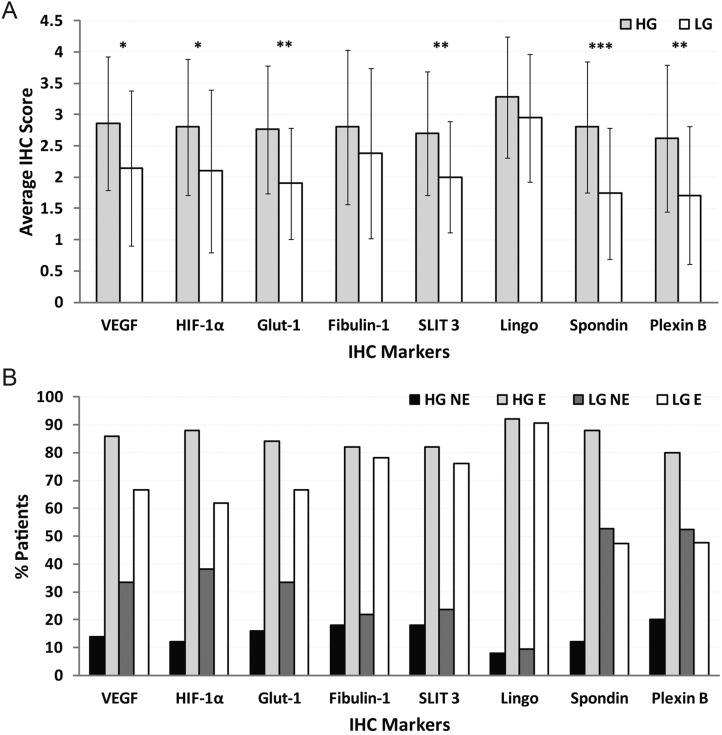
Fig. 2.
Spondin1, SLIT3, and Plexin-B2 levels are higher in high-grade (HG) gliomas compared with the levels in low-grade (LG) gliomas. (A) Graph showing average IHC scores for biomarkers VEGF, HIF-1α, GLUT-1, fibulin-1, SLIT3, spondin1, LINGO1, or Plexin-B2 in high-grade gliomas (50 patients: 21 female and 29 male) and low-grade gliomas (21 patients: 10 female and 11 male). Scores were obtained using the following grading criteria—0: 0%; 1: 0–<25%; 2: 25–<50%; 3: 50–<75%; 4: 75–100% detection of IHC stain. Significant differences in marker levels between HG and LG were established when *P < .05, **P < .01, or ***P < .001. Actual P-values for each biomarker are: .0161 for VEGF, .0227 for HIF-1α, .0013 for GLUT-1, .2081 for fibulin-1, .0069 for SLIT3, .2054 for LINGO1, .0004 for spondin1, and .0035 for Plexin-B2. (B) Graph showing the percentage of patients that expressed biomarkers stained by IHC in high-grade gliomas (50 patients) and low-grade gliomas (21 patients). A negative expression (NE) result was attributed to IHC scores of 0 or 1. A positive expression (E) result was attributed to IHC scores of 2–4.

