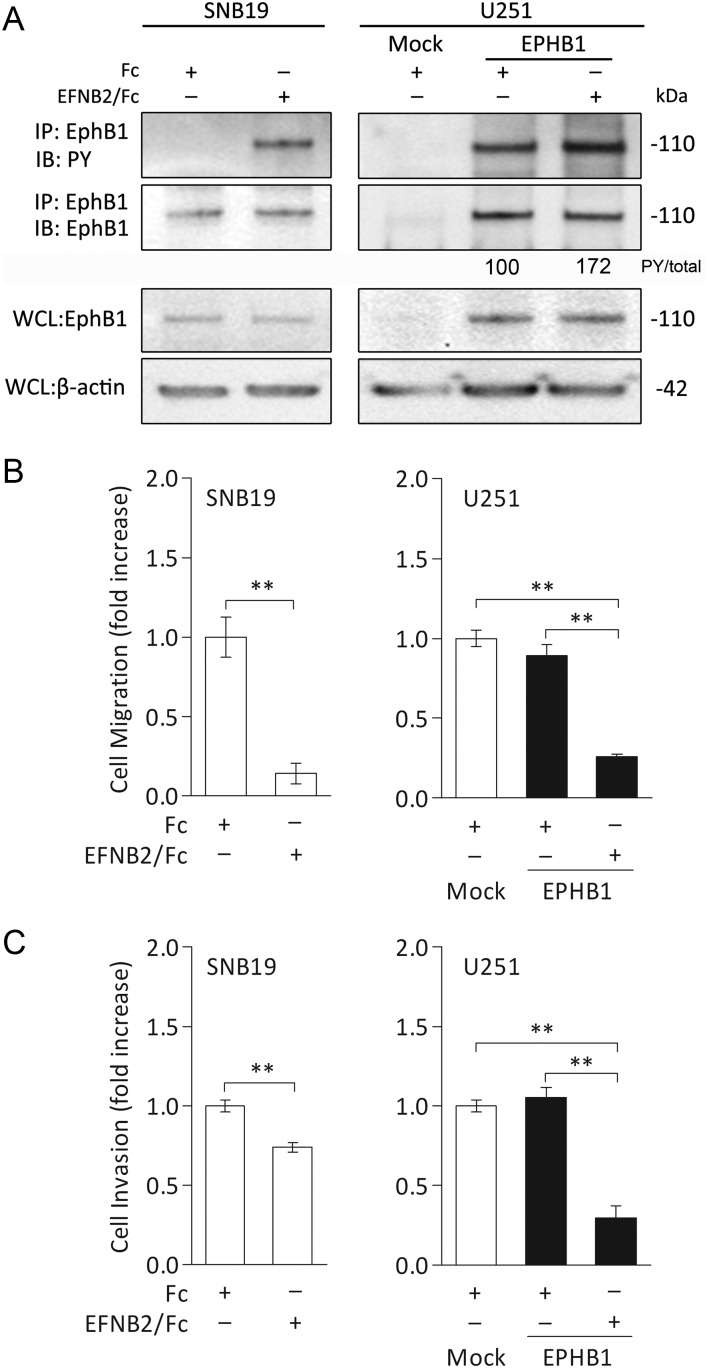
Fig. 4.
Cell migration and invasion analysis of glioma cell lines stimulated with ephrin-B2/Fc chimera. (A) Extracts of SNB19 and U251 cells transfected with empty plasmid vector (mock) or EphB1 vector (EPHB1) were immunoprecipitated (IP) with anti-EphB1 antibody. Cells were treated with 2.0 μg/mL soluble ephrin-B2/Fc (EFNB2/Fc) or control Fc fragment (Fc) for 10 min before collection. Whole cell lysates (WCL) were also immunoblotted (IB) with anti-EphB1 antibody and anti–β-actin antibody as a loading control. PY, phosphotyrosine. The numerical values indicate relative ratios as a percentage of the PY/total (PY-EphB1:total-EphB1) band in EphB1 transfectants after scanning and analysis using software by Nucleovison (NucleoTech). (B) SNB19 and U251 cells were treated and then plated on fibronectin-coated membranes in a chemotaxis chamber. Ephrin-B2/Fc or control Fc fragment was applied to a final concentration of 2.0 μg/mL for 10 min to the lower chamber. Cells migrated to the underside surface of membrane for 8–10 h, then migrated cells were stained and absorbance measured at 590 nm. The mean absorbance (590 nm) value from the cells treated with control Fc in SNB19 or mock-transfected U251 was shown as 1. Bars, SD; n = 6, **P < .01. (C) Cells were treated as previously and then applied to the invasion assay. Columns, mean cell counts from at least 6 fields in each of 3 experiments. The mean value from the cells treated with control Fc in SNB19 or mock-transfected U251 was normalized as 1. Bars, SD; n = 6, **P < .01.

