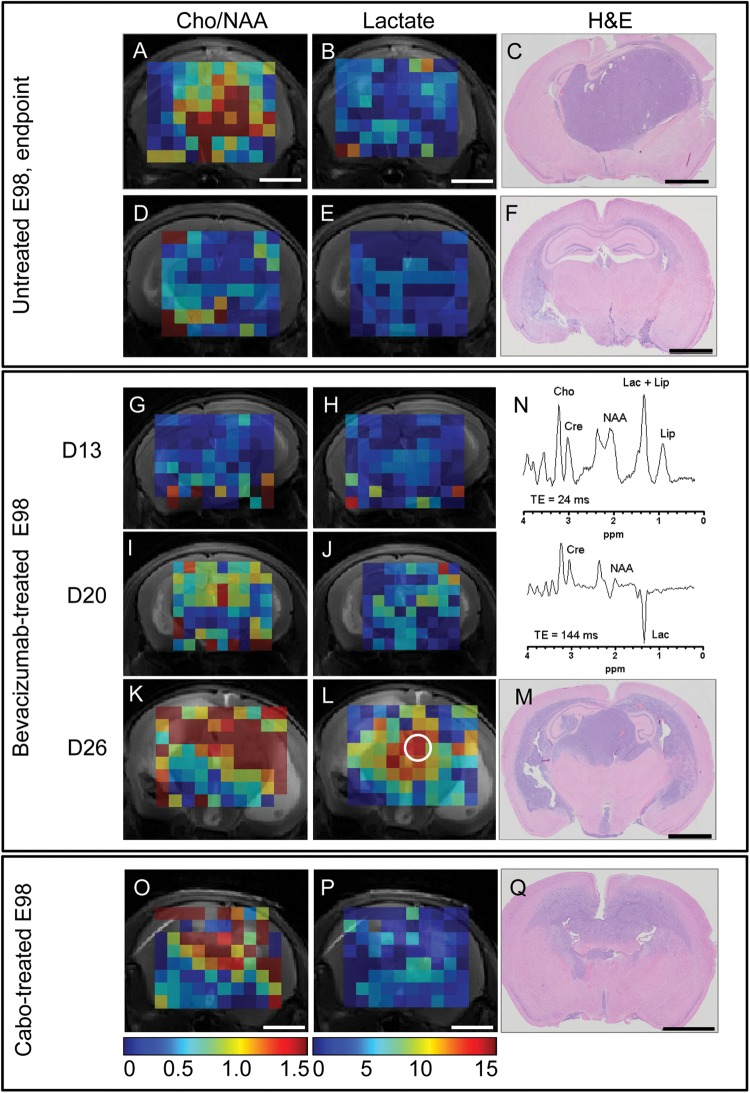
Fig. 3.
Bevacizumab treatment results in a highly localized increase in lactate production in E98 xenografts. Panels A and D show maps of Cho/NAA metabolite ratios (range 0–1.5, values obtained using TE = 24 ms); in panels B and E, absolute lactate concentrations are depicted (range 0–15 mM, values obtained using TE = 144 ms). C and F represent H&E stained corresponding coronal sections (same animals as shown in Fig. 1). (A–F) untreated; (G–M) bevacizumab-treated. Panels G–H, I–J, and K–L represent MRS maps at days 13, 20, and 26 post tumor implantation, which corresponds to days 0, 7, and 13 of bevacizumab treatment. Note in panels J and L that lactate levels gradually increase after treatment with bevacizumab, but predominantly in compact tumor areas. Panel N shows a representative short (24 ms) and long (144 ms) echo time MR spectrum of a selected voxel of the bevacizumab-treated animal (day 26, white encircled voxel in panel L). Panels O–Q represent mouse brains with E98 xenografts after treatment with cabozantinib. Note that only low levels of lactate are observed (P), whereas high Cho/NAA ratios are detected throughout the tumor (O). All metabolite values were obtained using LCModel and plotted regardless of the Cramér–Rao lower bound value of the fits. Voxels in which one of the metabolites could not be fitted by LCModel are omitted. Size bars correspond to 2 mm.

