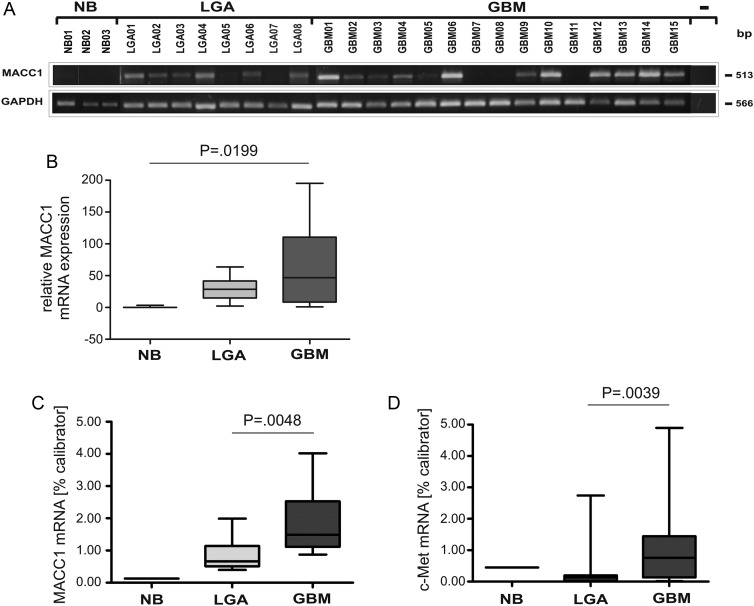
Fig. 5.
Expression analysis of MACC1 and c-Met mRNA in human astrocytic tumor samples by semiquantitative RT-PCR and quantitative real-time RT-PCR. (A) Total RNA from NB, LGA WHO grade II, and GBM tissue samples was used as a template for semiquantitative MACC1 RT-PCR analysis. For negative control, cDNA was excluded from the PCR reaction (−). The various cDNA concentrations were normalized to that of the housekeeping gene GAPDH, which was used as internal loading control. The size (bp) of the PCR products is indicated on the right. The numbers refer to the tumor samples used (Table 1). (B) Box plot analysis of densitometrically quantified MACC1 mRNA expression. ANOVA revealed a statistically significant increase of MACC1 mRNA expression (P = .0199). (C) Quantitative real-time MACC1 RT-PCR of human NB (n = 1), LGA (n = 12; median: 0.658), and GBM (n = 17; median: 1.486) tumor samples. The increase in MACC1 mRNA expression of GBM was statistically significant (P = .0048). (D) Quantitative real-time c-Met RT-PCR of human NB (n = 1), LGA (n = 12; median: 0.122), and GBM (n = 17; median: 0.755) tumor samples. The increase in c-Met mRNA expression in GBM was statistically significant (P = .039).

