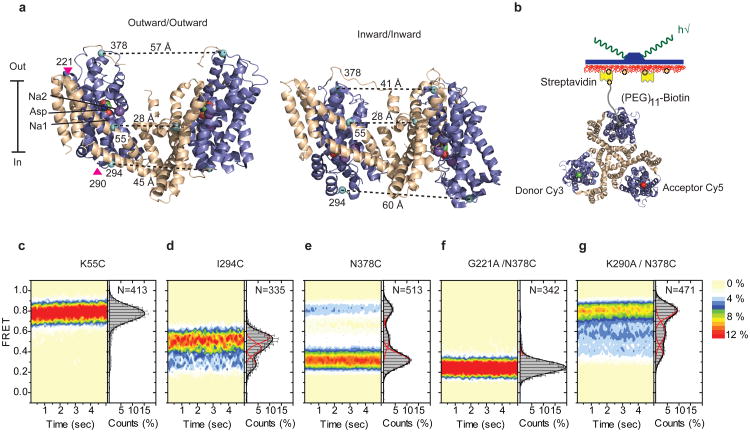
Figure 1. FRET efficiency changes reflect relative orientations of the transport domains.
a, GltPh protomer pairs in symmetrical outward- and inward-facing states viewed within the membrane plane. Trimerization and transport domains are colored wheat and blue, respectively. Bound Asp and Na+ ions are emphasized as spheres and colored by atom type. Introduced cysteines are highlighted in cyan with inter-protomer distances above the dotted lines. Magenta arrows mark sites of mutations altering state distributions. b, Labeling and surface-immobilization strategies. c-g, FRET efficiency population histograms for Asp/Na+-bound transporters. Introduced mutations are indicated above the panels. The number of molecules analyzed (N) is shown. Population contour plots (left) are color-coded from tan (lowest) to red (highest population) with the color scale shown next to the graphs. In the cumulative population histogram (right), the solid black lines are fits to the sums of individual Gaussian functions (red lines).

