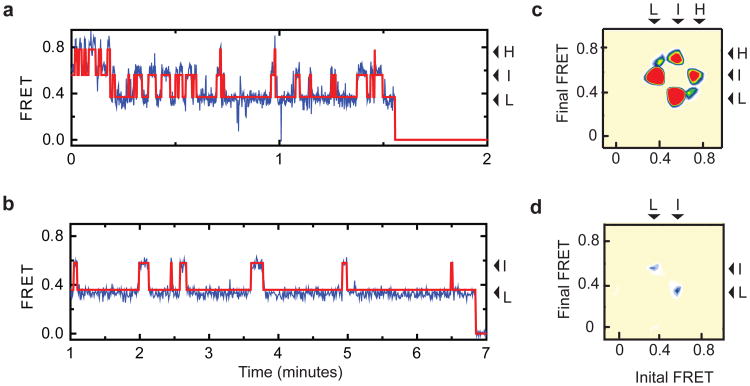
Figure 2. Dynamics in the apo and substrate bound transporter.
a-b, Shown are smFRET trajectories (blue), acquired for apo (a) and Na+/Asp-bound (b) GltPh-N378C. Overlaid are idealizations generated in QuB (red). Arrows mark population averages for the low- (L), intermediate- (I) and high- (H) FRET efficiencies. Data in panel b was collected using 400 ms integration time. c-d, Transition density plots for the apo (c) and Na+/Asp-bound (d) transporters show that transitions occur between three distinct FRET states (L, I and H) with an average frequency of ∼0.5 s−1 and ∼0.02 s−1, respectively. Initial and final FRET values for each transition are accumulated into two-dimensional histograms. Color scale is from tan (lowest frequency) to red (highest frequency).

