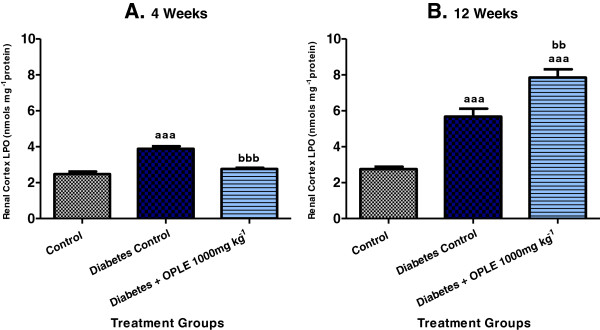
Figure 2.

Effect of OPLE on renal cortical LPO concentration in the 4-week (A) or 12-week (B) study. Data are expressed as mean ± SEM (n = 6 per group). aaaP < 0.001 vs. corresponding control; bbP < 0.01, bbbP < 0.001 vs. corresponding diabetes control.
