
Figure 2.
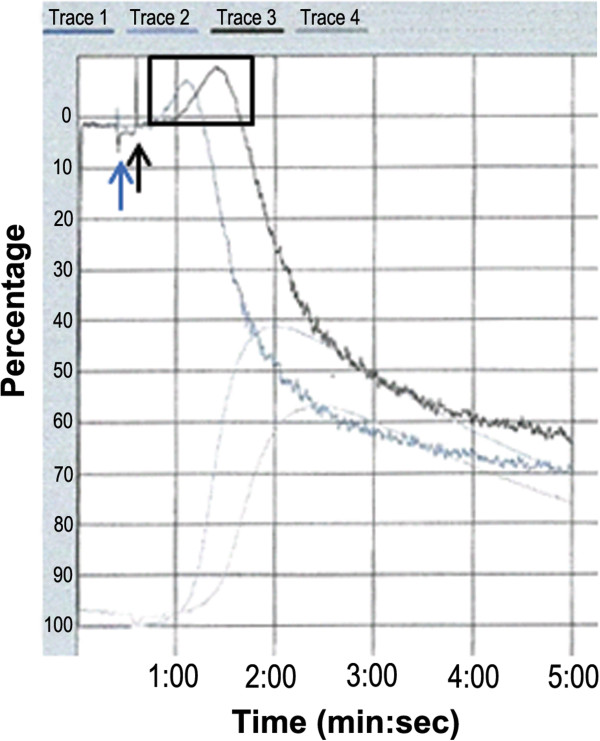
More pronounced shape change of platelets of Nbea+/-mice upon collagen stimulation. Collagen was added to wild-type and heterozygous platelet-rich plasma samples, respectively, at time points indicated by the blue and black arrows. Upon collagen stimulation, ATP secretion and aggregation were measured in the following 5 minutes. Trace 1 and 3 visualize the aggregation of platelets from Nbea+/+ and Nbea+/- mice, respectively. The shape change preceding the aggregation is indicated with a black rectangle. All replication experiments show a similar, more pronounced shape change for Nbea+/- mice. Traces 2 and 4 are the visualization of the ATP secretion of platelets of Nbea+/+ and Nbea+/- mice, respectively (n = 4 mice/genotype). Quantification of total ATP secretion was done after corrections for background values (ATP secretion in platelet-poor plasma). Though it seems that there were differences between the ATP secretion curves for Nbea+/+ and Nbea+/- mice in this experiment, quantification of ATP secretion values after correction for backgrounds in triplicate experiments, as shown in Table 1, showed no significant differences between genotypes.