Figure 5.
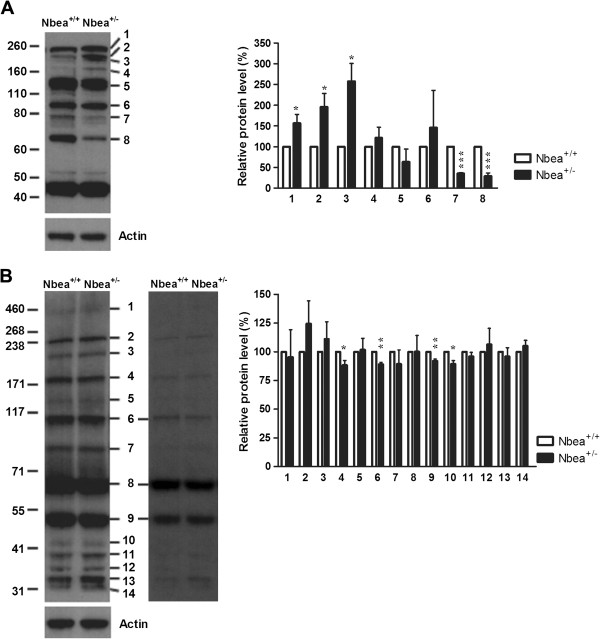
Abnormal Protein kinase A(PKA) phosphorylation pattern in Nbea+/-mice. Visualization of proteins phosphorylated by PKA revealed several changes in phosphorylation levels of proteins in resting platelets (A) and brain lysates (B) of Nbea+/- mice. Phosphorylation levels were first calculated within a litter, followed by t-test for single means, with the mean of wild-type samples being 100%, to detect significant differences between Nbea+/+ and Nbea+/- mice. (A) In resting platelets the three proteins with the highest molecular weight had a significantly higher phosphorylation status. The following three bands had an unaltered phosphorylation level whereas the last two bands had a significantly reduced phosphorylation profile (n = 4 samples/genotype). (B) Two different exposure times are shown for the PKA phosphorylation pattern of brain tissue, which were used for quantification. Image analysis revealed a significant decrease in phosphorylation level of four different proteins in brain tissue of Nbea+/- mice (n = 5 samples/genotype).

