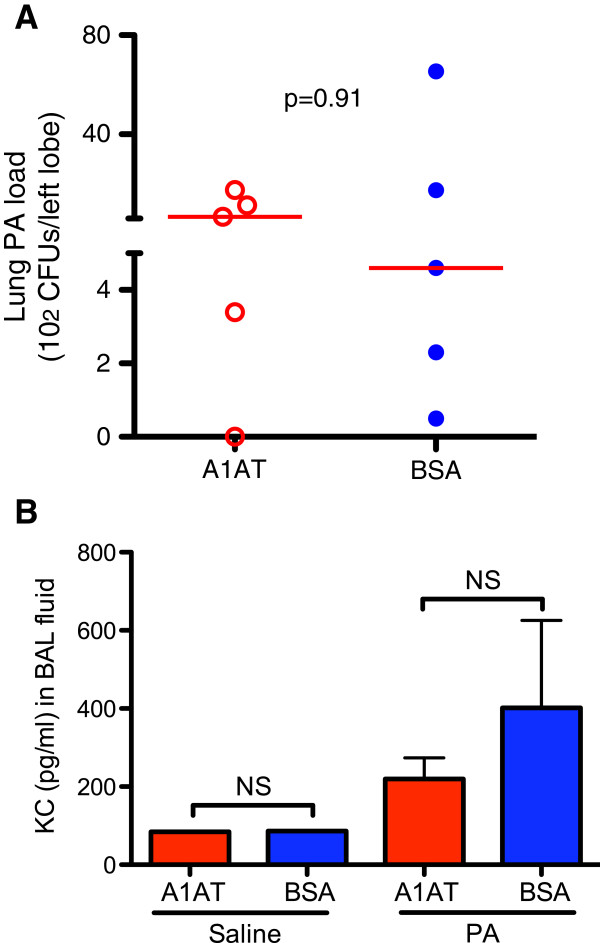
Figure 5.
A1AT treatment does not reduce lung PA load and inflammation in SPLUNC1 knockout (KO) mice. (A) – PA load was quantified in homogenized left lungs. The horizontal solid red lines indicate medians of CFUs. (B) – KC levels were quantified by using an ELISA. N = 4 – 7 mice per group. NS indicates no significant differences. Data are expressed as means ± SEM.

