
Figure 5.
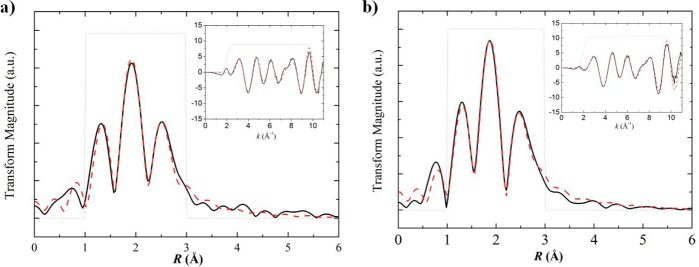
Fe K-edge EXAFS Fourier transforms and EXAFS spectra (inset) for (a) 1 and (b) UiO-66-[FeFe](dcbdt)(CO)6. Solid black lines show the experimental data, dashed red lines show the fits based on crystallographic data of 1, and dotted gray lines show the fitting window.