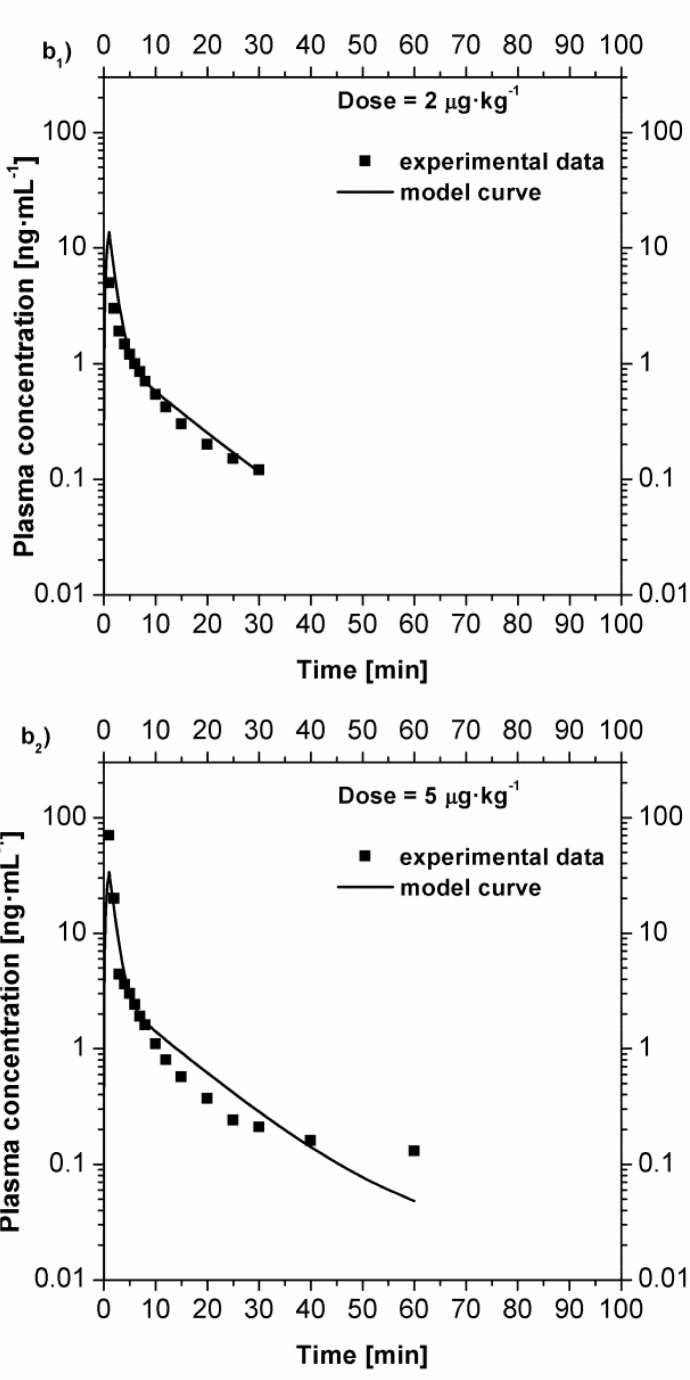
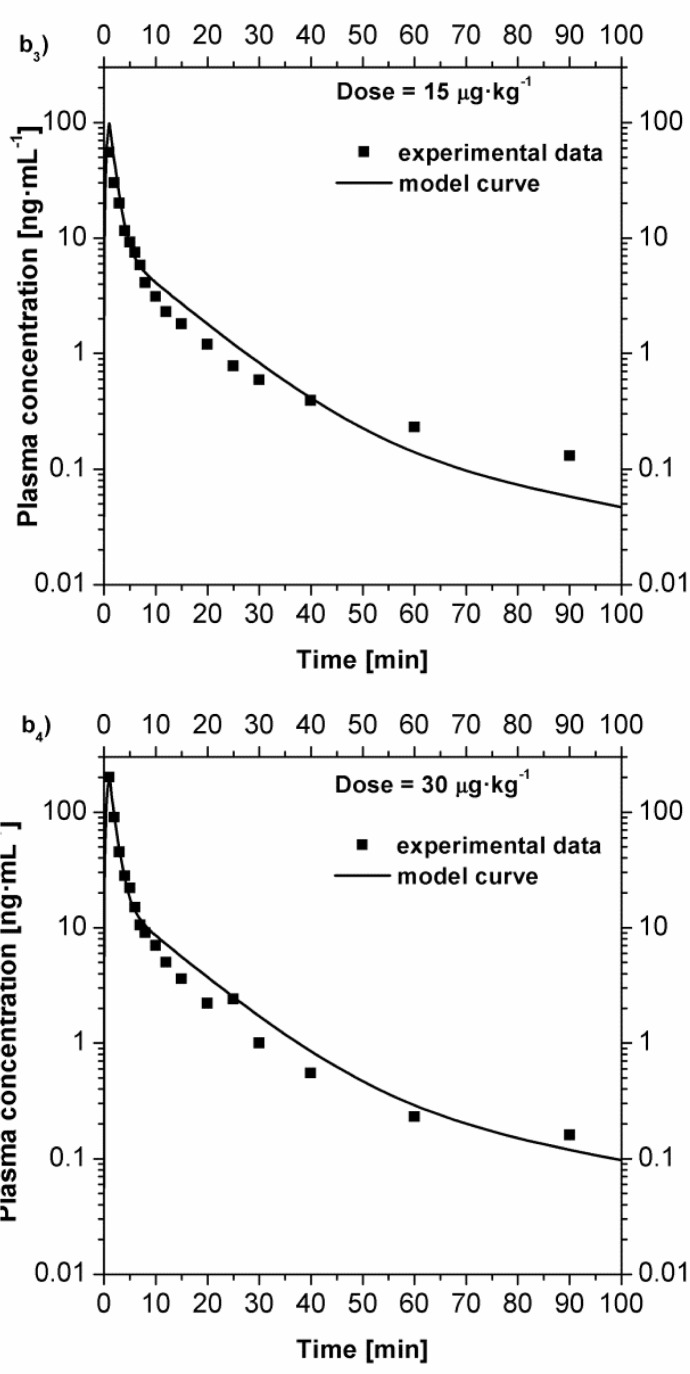
Fig 4 .
Comparison between the experimental plasma concentration value [ 4 ] and the model curves in the case of fast intravenous infusion (bolus). b 1 ) plasma concentration after a dose of 2 μg·kg −1 ; b 2 ) plasma concentration after a dose of 5 μg·kg −1 ; Comparison between the experimental plasma concentration value [ 4 ] and the model curves in the case of fast intravenous infusion (bolus). b 3 ) plasma concentration after a dose of 15 μg·kg −1 ; b 4 ) plasma concentration after a dose of 30 μg·kg −1 .


