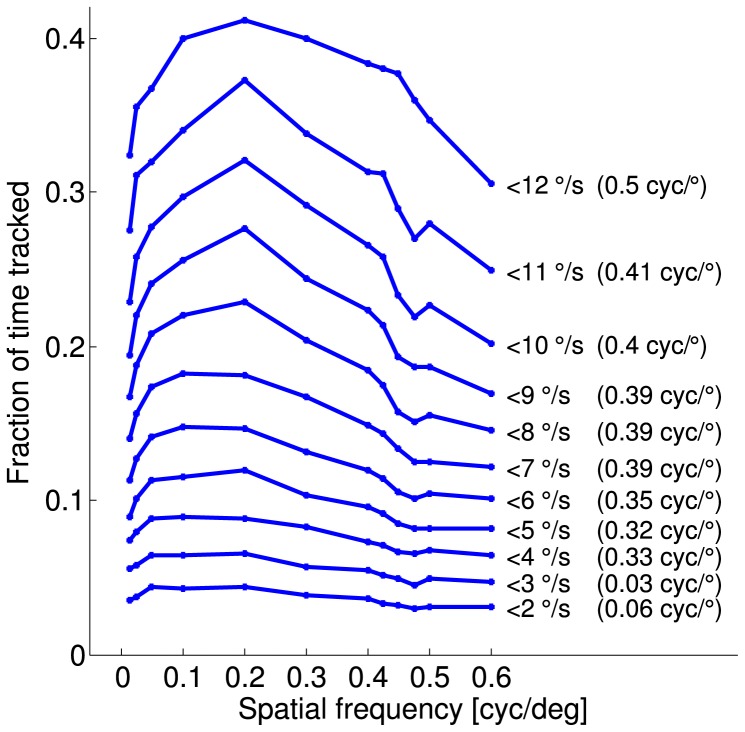
Figure 5. Effect of the variation of the discrimination criterion.
The response curves were calculated on basis of the individual normalized responses of the 6 animals (as in figure 8) for different values of the discrimination criterion  (values from 2 to 12
 /s, shown to the right of each curve). The fraction of time tracked (
 ) increases when softening the criterion, but the shape of the response curve as well as the estimated visual acuity based on logistic fits of the median responses (shown in brackets on the right) remains qualitatively similar in a certain range around the standard value of
  = 9
= 9 /s.
/s.

