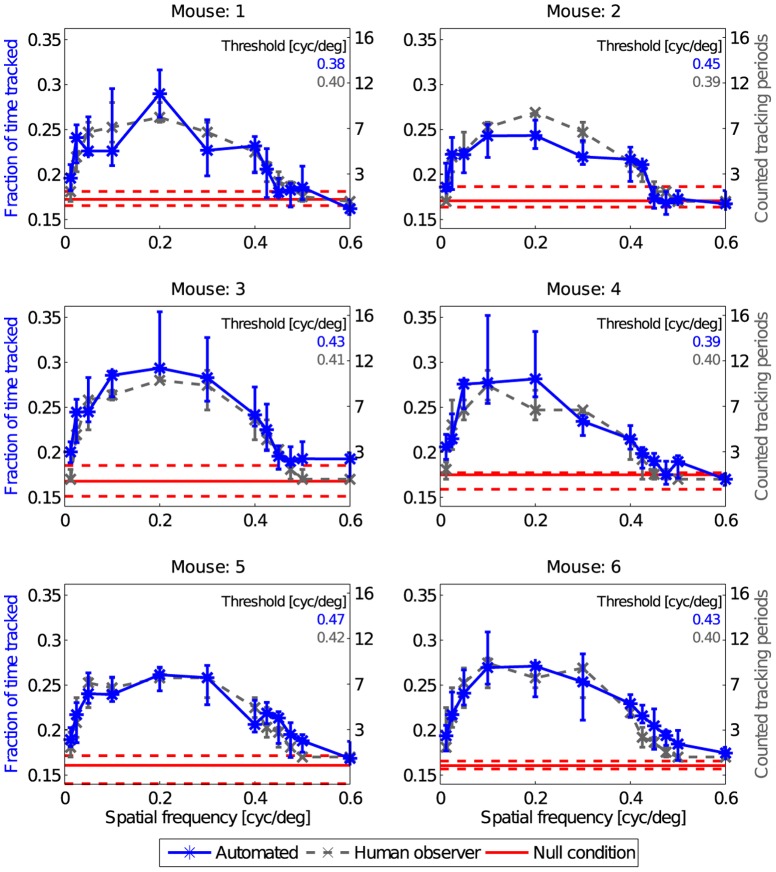
Figure 6. Individual OMR performances.
The amount of tracking movements counted by the human observer (dashed gray line, not normalized, right axes) compared to the automatically determined response curve when using a discrimination criterion of  = 9
= 9 /s (blue line, not normalized, left axes) for the six individual animals. All values are unnormalized medians over 10 stimulus presentations. The errorbars represent the variation of individual responses by showing the upper (75%) and lower (25%) quartiles of responses to each spatial frequency. The solid red line is the median for the measurements at null condition (not moving stimulus), the red dashed red lines represent the quartiles at this condition. The calculated individual spatial acuity thresholds are shown in the upper right corner of each graph.

