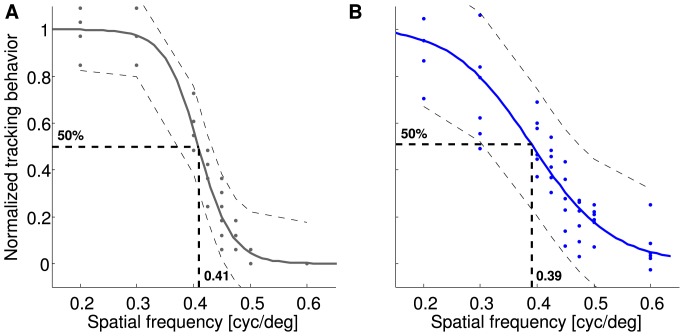
Figure 7. Determination of spatial frequency threshold.
The descending slope of the response curves obtained by the human observer (gray dots, A) and of the automated analysis (blue dots, B) was fitted by a logistic function (gray and blue lines). Curve fitting was done based on the median values obtained for the six animals and each spatial frequency. Dashed lines indicate the prediction bounds, in which 95% of new measurements are expected to lie. The visual threshold was defined as the spatial frequency value at the inflection point (50% of the maximum response), resulting in 0.41 cyc/ for the human observer approach and 0.39 cyc/
 for the automated analysis.

