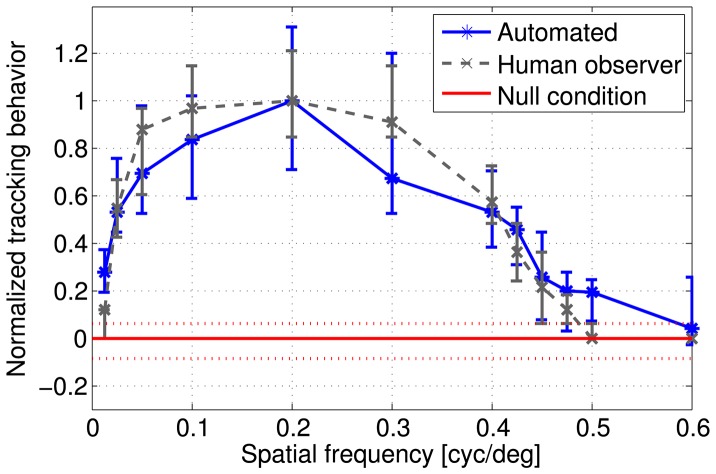
Figure 8. Automated and human observer analysis of OMR performance.
The normalized response curves determined by the human observer (dashed gray line) and by the automated analysis (blue line, discrimination criterion  = 9
= 9 /s) are similar. For each spatial frequency, the median of response of all mice was calculated based on the median values for each individual mouse. Responses are normalized by setting the median value obtained for the optimal spatial frequency to one. For the automated analysis, chance level was calculated as the median of the number of head movements matching the discrimination criterion by chance at null condition during absence of movement. It was set to zero (red line) by subtracting this chance value from all values obtained by the automated analysis. Errorbars and dotted red lines represent the variation between animals by showing the smallest and highest medians obtained for the six animals during stimulation and null condition. (See Methods for details).

