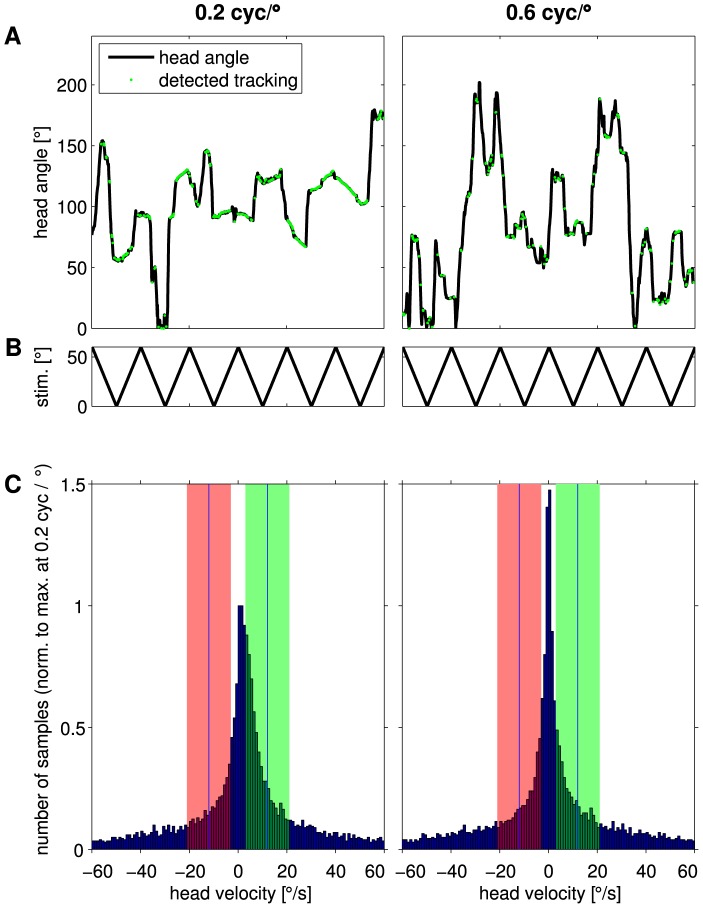
Figure 9. Recorded head-angles.
A: Example course of the recorded head-angle over time of one animal at the optimal spatial frequency of 0.2 cyc/ (A left) and a spatial frequency of 0.6 cyc/
 (A right), at which the human observer does not detect OMR behavior. Samples where the head angular velocity deviates less than
  = 9
= 9 /s from the stimulus velocity of 12
 /s are highlighted in green. Significantly more frames fulfill this criterion and are hence automatically detected as stimulus tracking behavior at 0.2 cyc/
 than at 0.6 cyc/
 . B: Movement of the grating over time. C: Histogram of head velocities of all animals induced by the gratings with spatial frequencies of 0.2 cyc/
 (left) and 0.6 cyc/
 (right), both moving with 12
 /s. Positive numbers correspond to head-movements in the same direction as the stimulus moved, negative numbers to head-movements to the opposite direction. The green area indicates the region of head velocities that was tolerated as tracking behavior. To visualize the more strongly skewed distribution found for responses to 0.2 cyc/
 in contrast to 0.6 cyc/
 , head-movements that occurred in the range of tolerated speeds but in the wrong direction are highlighted by the red area.

