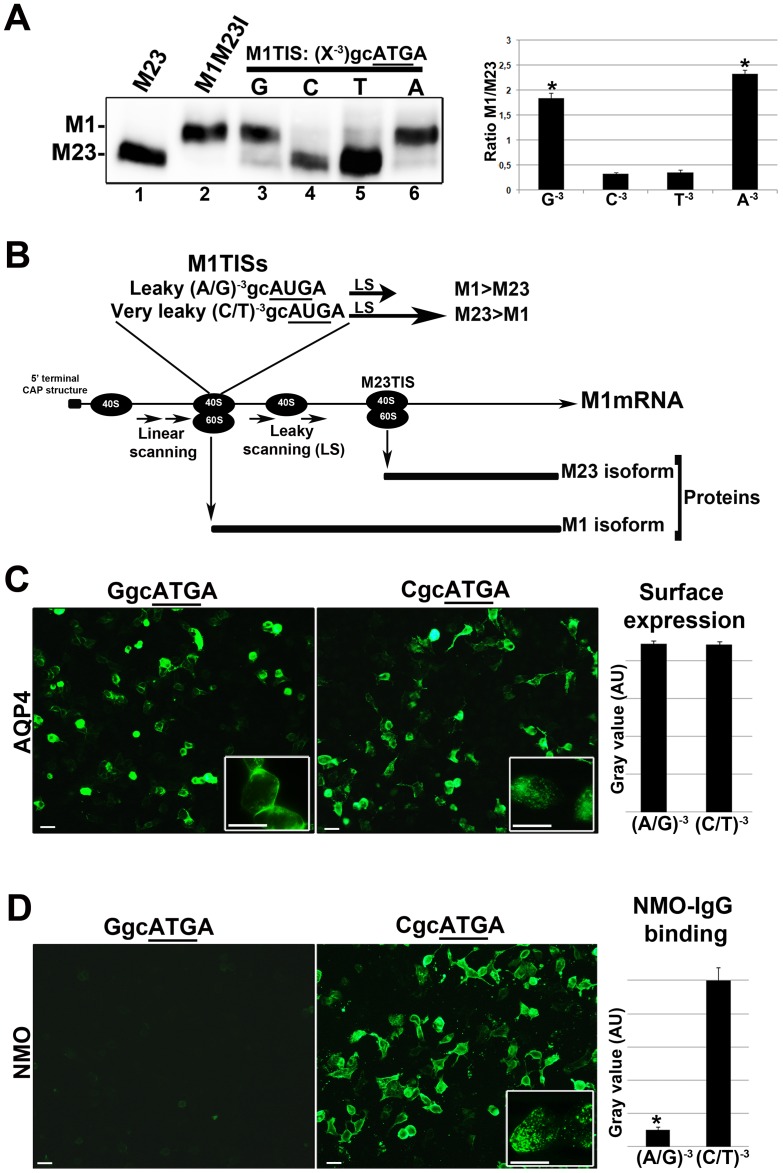
Figure 1. Correlation between AQP4-M1 CDS cloning strategy, LS frequency, the AQP4-M1/M23 ratio and NMO-IgG binding.
(A): Immunoblot experiment performed using commercial AQP4 antibodies on cells transfected with different AQP4 expressing constructs. From the left: lane 1, AQP4-M23 exclusively producing AQP4-M23, lane 2, AQP4-M1M23I (with the methionine in position 23 mutated into Isoleucin), exclusively producing AQP4-M1, lane 3–6: the four constructs under analysis with G or C or T or A, in the N−3position, as indicated. On the right: densitometric analysis of the AQP4-M1 and AQP4-M23 bands reported as the AQP4-M1/M23 ratio (n = 4), *P<0.01, (A−3/G−3) vs (C−3/T−3). (B): Illustration showing the cap-dependent translation and relative LS frequency on AQP4-M1 mRNA depending on TIS. (C) Left: immunofluorescence experiment, using AQP4 commercial antibody, performed on AQP4-M1 with TIS (G)−3gcAUGA+4, and AQP4-M1 with TIS (C)−3gcAUGA+4, transfected cells. Right: quantitative analysis of the fluorescence signal obtained by TIRF microscopy of transfected cells with vectors having a purine (A−3/G−3) or a pyrimidine (C−3/T−3) at the N−3, (n = 4). (D) Left: immunofluorescence experiment performed on transiently transfected cells using NMO sera (collection of 20 NMO sera). The level of NMO-IgG binding is very low in cells transfected with AQP4-M1 with TIS (G)−3gcAUGA+4, while it is high in cells transfected with AQP4-M1 with TIS (C)−3gcAUGA+4. Right: quantitative analysis of NMO-IgG binding on cells transfected with vectors having a purine (A−3/G−3) or a pyrimidine (C−3/T−3) at the N−3, analyzed by immunofluorescence (n = 4). *p<0.01. Magnification bar 10 µm.

