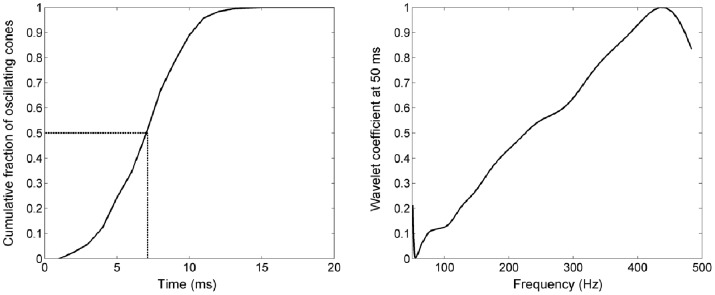
Figure 4. Fluctuation parameters for the cone population in one sequence.

Left: Cumulative fraction of cones that showed detectable fluctuations, as a function of time. 50% of cones were observed to oscillate by ∼7 ms. Right: Average wavelet coefficient for the cone population in one sequence, at t = 50 ms (the time point at which valid sampling in frequency space is the widest). The linearity in frequency space is suggestive of a process that is non-linear with time.
