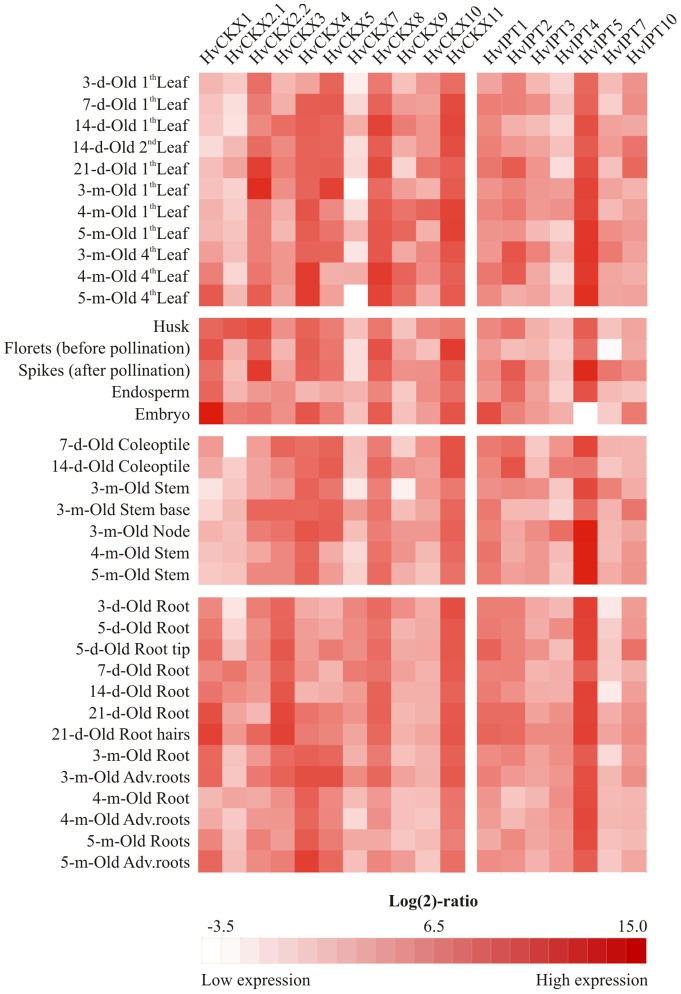
Figure 1. Expression profiles of CKX and IPT genes in indicated tissues and organs during the lifespan of barley plants.
The heatmap illustrates transcript levels detected in 1-ratios and are colour-coded from white to red (the lowest and highest detected transcript numbers, respectively). Real values of at least two biological replicates with standard deviations are summarized in Table S3.

