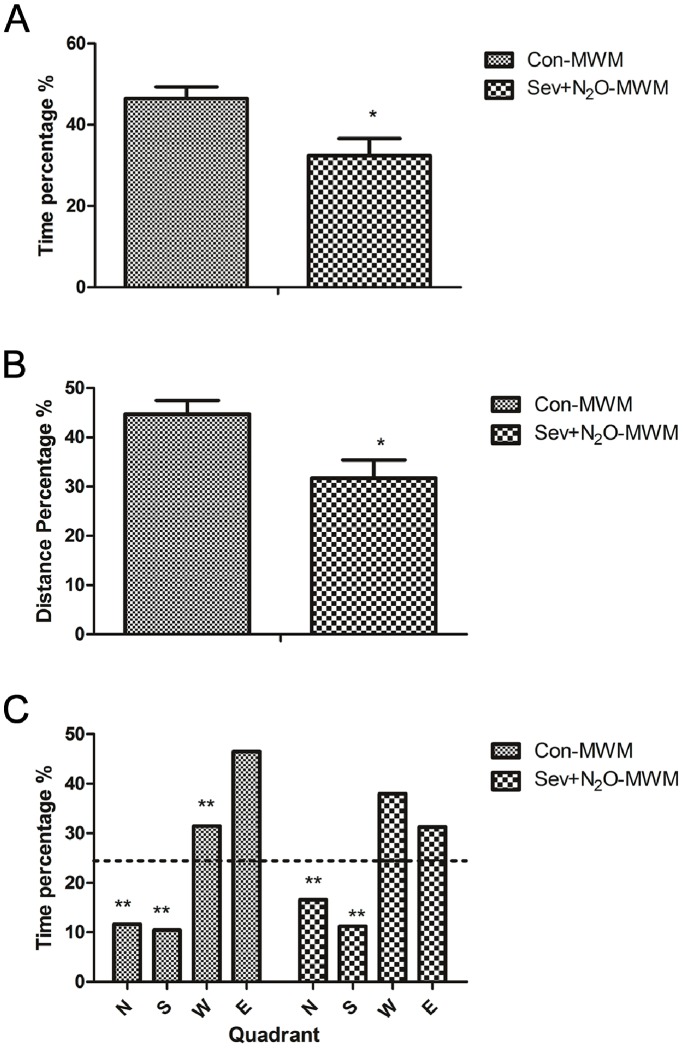
Figure 2. Probe trial conducted after the last water maze acquisition.
(A) The percentage of time spent in the target quadrant. (B) The percentage of distance traveled in the target quadrant. (C) The percentage of time spent in each quadrant. Results are represented as mean ± SEM. *p<0.05, **p<0.01.

