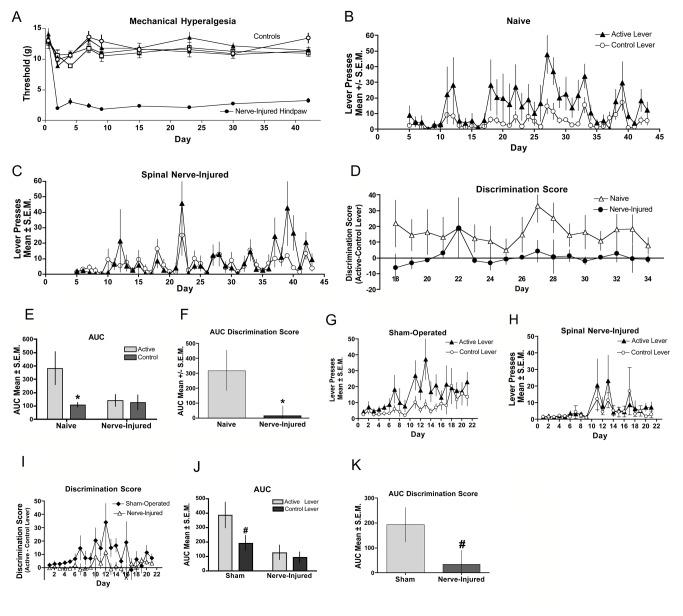
Figure 3. Fentanyl self-administration in peripheral nerve injury: (A-F).
(A) Spinal nerve ligation was performed the day before the first self-administration session. Mechanical hyperalgesia was assessed through day 42 of the study. Hindpaws ispilateral to the injury (closed circles) demonstrated significantly (p < 0.05) reduced thresholds to paw withdrawal relative to contralateral hindpaws (open circles), sham-operated (triangles) or naive controls (squares). Naive (B) and Nerve-injured (C) mice were assessed for establishment of fentanyl self-administration by comparing bar pressing on the active lever with that on the control lever. (D) The magnitude of discrimination between the active and control levers are displayed for the duration of the testing period for naive (closed circles) and nerve-injured (open triangles) mice. (E) Analysis of the AUC for the groups in B and C indicate that mice with SNL-induced hyperalgesia did not lever press for fentanyl. (F) Analysis of the AUC for the groups in D show that naive mice discriminated between the active and control levers, while mice with SNL-induced hyperalgesia did not. (*significance for AUC was determined by Student’s t-test; p < 0.05 n=7 per group). (G-K) In a separate experiment nerve-injured mice were compared to sham-operated control mice. Sham (G) and nerve-injured (H) mice were assessed for establishment of fentanyl self-administration by comparing bar pressing on the active lever with that on the control lever. (I) The magnitude of discrimination between the active and control levers are displayed for the duration of the testing period for sham-operated (closed diamonds) and nerve-injured (open triangles) mice. (J) Analysis of the AUC for the groups in G and H show that mice with SNL-induced hyperalgesia did not lever press for fentanyl. (K) Analysis of the AUC for the groups in panel I show that the discrimination scores of sham-operated mice differ from that of the nerve-injured mice. # indicates a statistical trend for AUC was determined by Student’s t-test; p < 0.1, n=8 per group.

