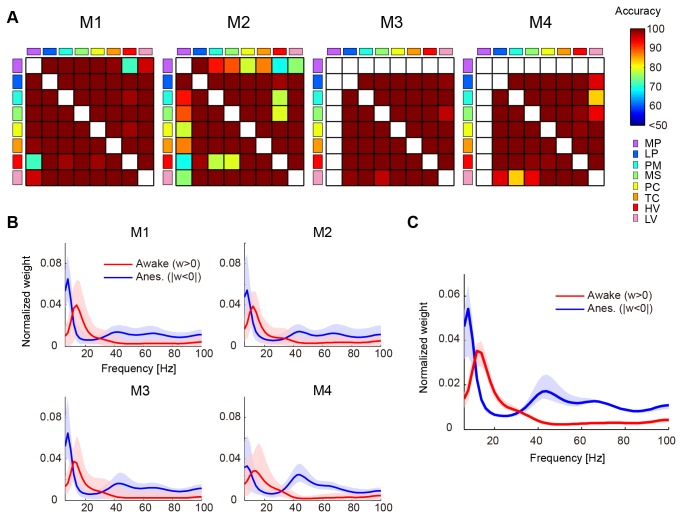
Figure 2. Accuracy of classifier between awake and anesthetized conditions and spectral distribution of classifier weight.
A: Accuracy of the classifier for all combinations of cortical region pairs for the 4 monkeys. White squares mean lack of data where no classifier was built. When the accuracy of a region pair was not significant, the accuracy was set to 50%.
B: The distribution of normalized weights for the awake (red) and anesthetized (blue) conditions averaged for all combinations of cortical region pairs. For preprocessing, the weight data of each region pair was normalized by the sum of the absolute value of weight and was averaged for all combinations of condition sample pairs. The normalized weights were averaged for all combinations of cortical region pairs and are shown in the line. The range from minimum to maximum values in cortical region pairs is shown by the shading around the line.
C: The distribution of averaged weights of region pairs for the awake (red) and anesthetized (blue) conditions for the 4 monkeys. The averaged distribution of the 4 monkeys is shown by a line plot, and the range from minimum to maximum values is indicated by the shading around the line.

