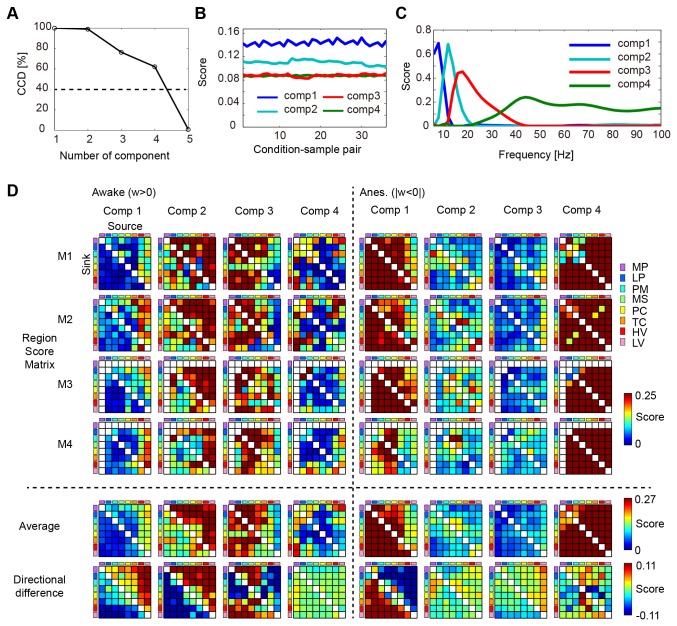
Figure 3. Network components extracted from the global pattern of the weight data by using PARAFAC.
A: CCD for the number of components. The threshold was set to 40%.
B: The scores for the dimension of condition sample pairs.
C: The scores for the dimension of frequency.
D: (M1-M4): The region score matrix for the awake and anesthetized conditions and for the 4 monkeys. (Average): The region score matrix was averaged for the 4 monkeys. (Directional difference): The difference of the scores between the 2 directions was calculated for each region pair.

