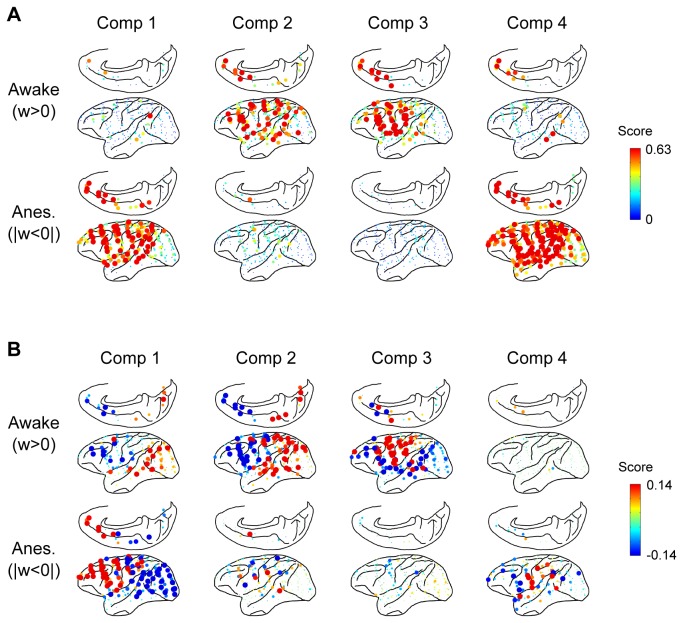
Figure 4. Spatial distribution of electrodes for information outflow and inflow in 4 network components.
A: The distribution of electrode scores was summed for 2 interaction directions. The value was calculated for each component and for awake and anesthetized conditions. A high score indicated that the electrode had very high interaction with other electrodes. The values for the 4 monkeys were superimposed on 1 brain map.
B: The distribution of electrode scores was summed for each interaction direction, and the difference between the 2 interaction directions was calculated for each component and for awake and anesthetized conditions. The red dot indicates that the information outflow of the electrode was larger than information inflow, and the blue dot indicates vice versa. The values for the 4 monkeys were superimposed on 1 brain map.

