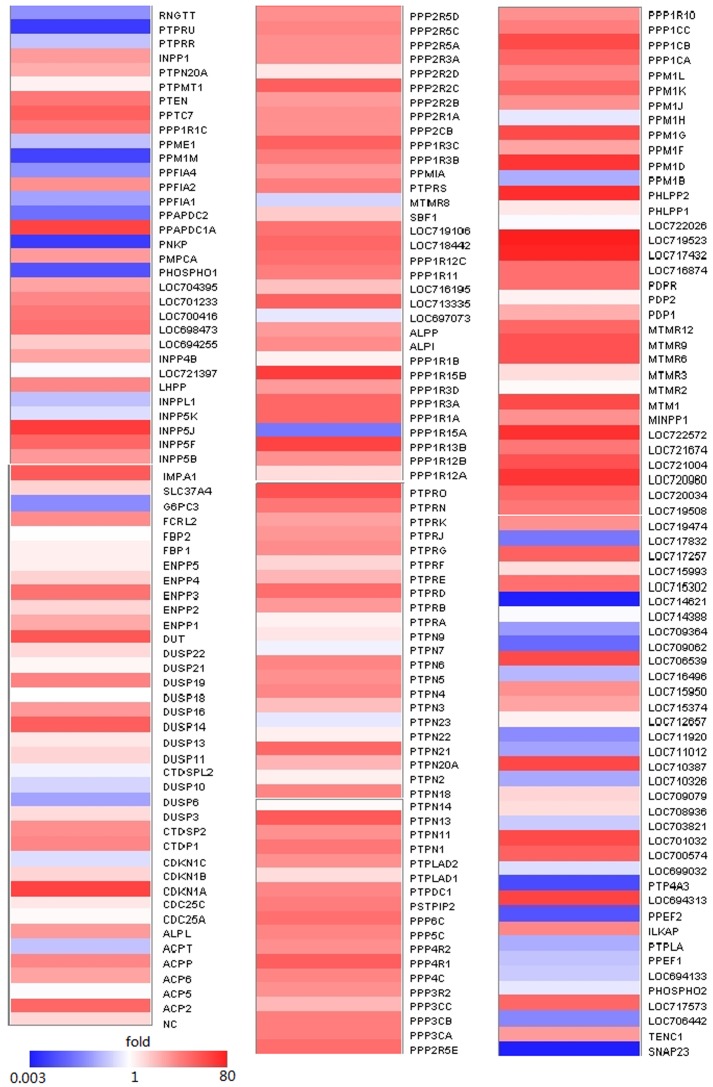
Figure 3. siRNA knockdown of different phosphatases led to different responses to HSV-1 infections.
Three siRNAs per gene were transfected in astrocytes followed by infection with HSV-1 (at an MOI of 0.01) in three independent experiments. Virus solutions were harvested at 48 h post infection, and the virus titer was determined by the CPE method and analyzed by calculating the normalized fold of CCID50/mL. The color scale reflects the fold of reduction or increase level of viral replication. These values (0.003-80) represent ratios of CCID50/mL (target/NC). NC refers to the negative control (value considered as 1).

